SD, SDIO, eMMC Protocol Analyzer (PGY-SSM) is the Protocol Analyzer with multiple features to capture and debug communication between the host and design under test. SD, SDIO, and eMMC Protocol Analyzer support SD, SDIO, and eMMC for data rates up to 200MHz (HS400) DDR mode. SD, SDIO, and eMMC Protocol Analyzer is the industry’s first eMMC protocol analyzer that supports version 4.41, 4.51, 5.0, and 5.1 specifications.
The innovative active probe has minimum electrical loading on the device under test (DUT) and allows protocol data capture without affecting the performance of the DUT. In an industry-first feature, the PGY-SSM protocol analyzer allows continuous streaming of protocol data from the PGY-SSM Protocol Analyzer to the host system (using USB 3.0 or GbE interface) running the UI. Comprehensive decoding of protocol data, command units, and real-time error analysis enables effective verification of communication of SD/SDIO/eMMC host and device.
PGY-SSM Protocol Analyzer enables design and verification engineers to test and debug SD, SDIO, and eMMC by triggering command, response, data, or CRC errors. It also provides instantaneous decoding of Command, Response, CID, CSD, and Ext CSD registers. The Analytics feature offers an easy analysis of the graphical representation of command, response, data, and frequency of operation for the acquired duration.
Continuous monitoring of protocol data for a long time to capture elusive events (more than 30GB data capture)
Analysis of captured data per standards for protocol integrity, count of data bursts, CMD CRC errors, Response CRC errors, Data CRC errors, Timing Values, and Reserved commands
Hardware-based protocol-aware trigger capability in real-time enables capturing specific Events. Triggering facility on patterns, commands, or error events.
Users can identify the anomalies by decoding command and response arguments
Analytics feature provides analysis of acquired protocol data by plotting command, response, data, and frequency of operation over acquired time
The analytics feature also provides the decoding of device registers for easy analysis
Filters allow you to view specific packets in decoded protocol packets
Search feature for specific events in protocol activity
Easy-to-use user interfaces save time on the learning curve
Handles long-duration capture and displays the decoded data without demanding extensive resources in the host computer
Inserting markers [using Trigger-In] in protocol activity helps in correlating the input digital signal with Protocol Activity
Trigger-out signal for any specific protocol event allows triggering of other instruments such as oscilloscope
Interface to host system [running UI] using USB3.0 or Gigabit Ethernet interface
Flexibility to upgrade the hardware firmware using the GbE interface provides easy field up-gradation of firmware
Export of Decoded data packets to a txt file for further analysis.
Continuous streaming of protocol activity up to 30GB
Capture Mode
Manual Run/Stop, Time-specific
Capture Duration time
1 sec to 5 hours
Trigger on
Command, Response, CRC errors, Sequential trigger
Trigger Actions
Capture data and/or trigger out signal
Signal Input
Digital Signal input to mark the activities in Protocol activity
Host System Interface
USB3.0 or Gigabit Ethernet (Gbe) interface
Host Machine Minimum Requirements
Microsoft Windows 8, Windows 7, 16GB of RAM.
Storage with at least 50 GB HDD space for storing the acquired data.
Display with resolution of at least 1024×768
Setup
PGY-SSM Protocol Analyzer works on the principle of fat-pipe analysis where the analyzer probes are connected on the interface bus between the host and device[memory] of the unit under test. It captures all transactions that are going on between the host/device and does real-time analysis for errors + a detailed analysis of the captured data which is made available through UI running on a host system. Captured data is stored in the hard disk of the system running UI, enabling a long capture [expect to have enough free space in the hard disk]. PGY-SSM Protocol Analyzer interfaces to host using USB 3.0 [Super Speed] and GbE. PGY-SSM analyzer & UI software runs in the host machine. PGY-SSM protocol analyzer also can capture boot data for eMMC.
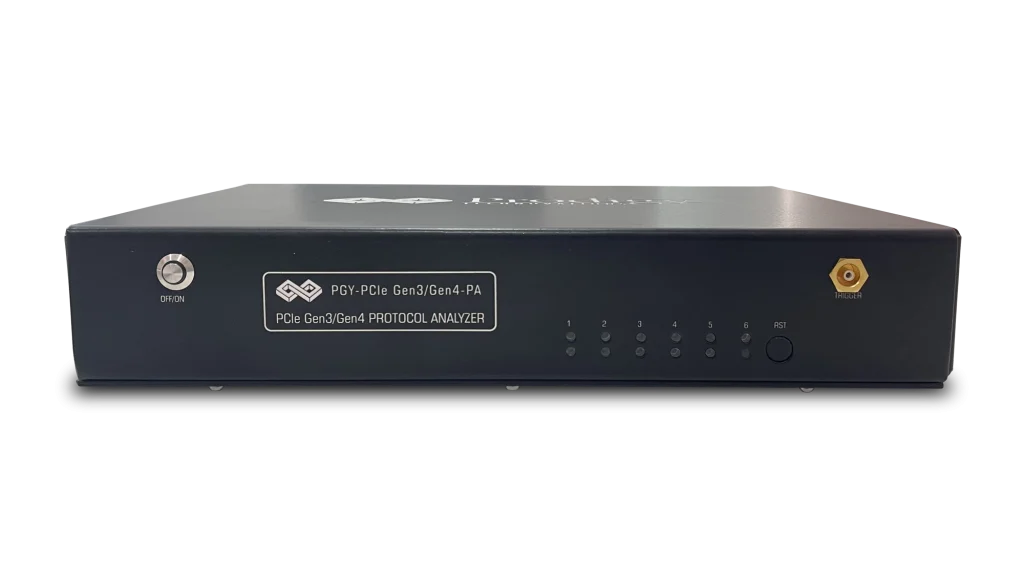
Probing
PGY-SSM Protocol Analyzer has an active probe, which provides very flexible probing with minimum electrical loading of DUT. This is specifically designed keeping to address challenges in probing eMMC/SD/SDIO signals. The probe supports 200MHz DDR bandwidth so that eMMC/SD/SDIO signals can be captured without any error. Probes have a flying probe lead set with a berg post connector and solder-able probe tips making it very convenient to connect to DUT.
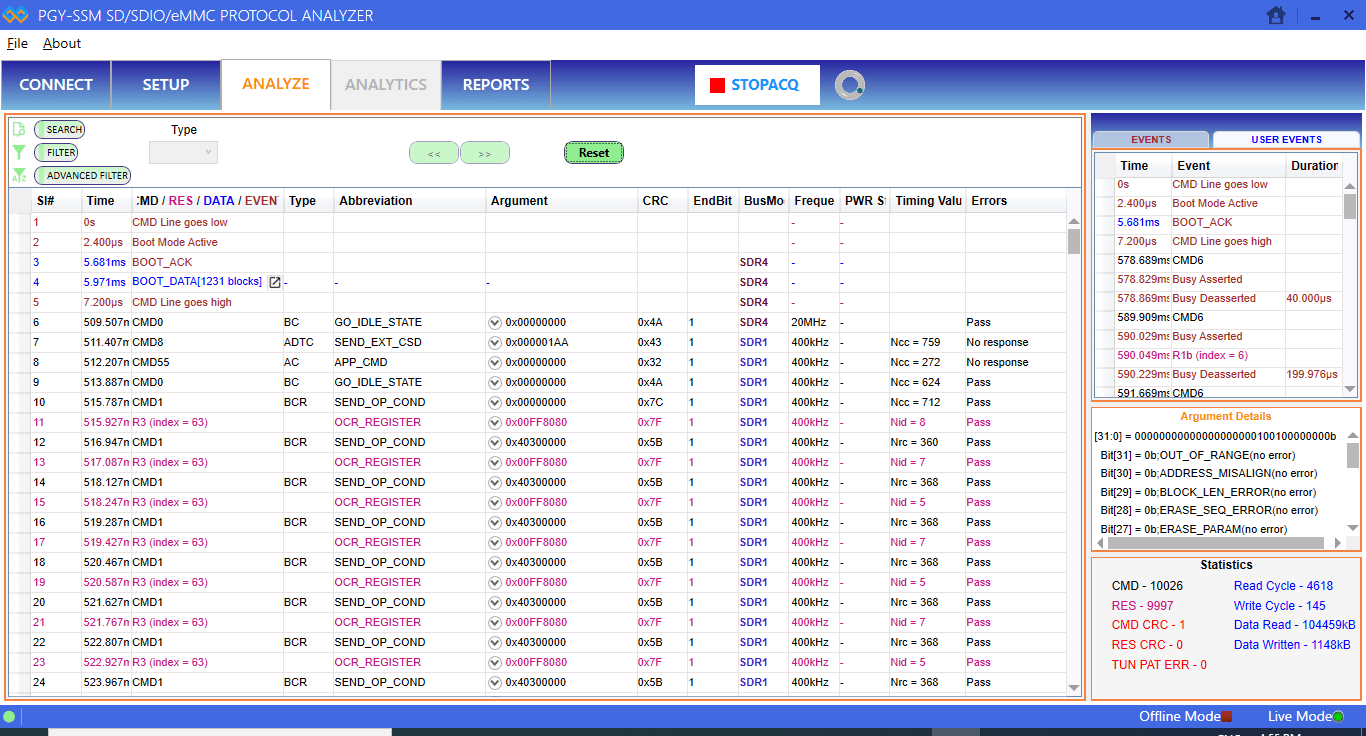
Comprehensive Protocol Analysis
PGY–SSM Software provides the industry’s best protocol analysis capabilities. A simple-to-use interface reduces the complexities and time for protocol debugging. Time-stamped view of decode listing provides a complete view of protocol activities between host and device. By clicking on selection prompts, the user can get the decode of arguments, CSD, CID registers, data activities, and more [detailed view]
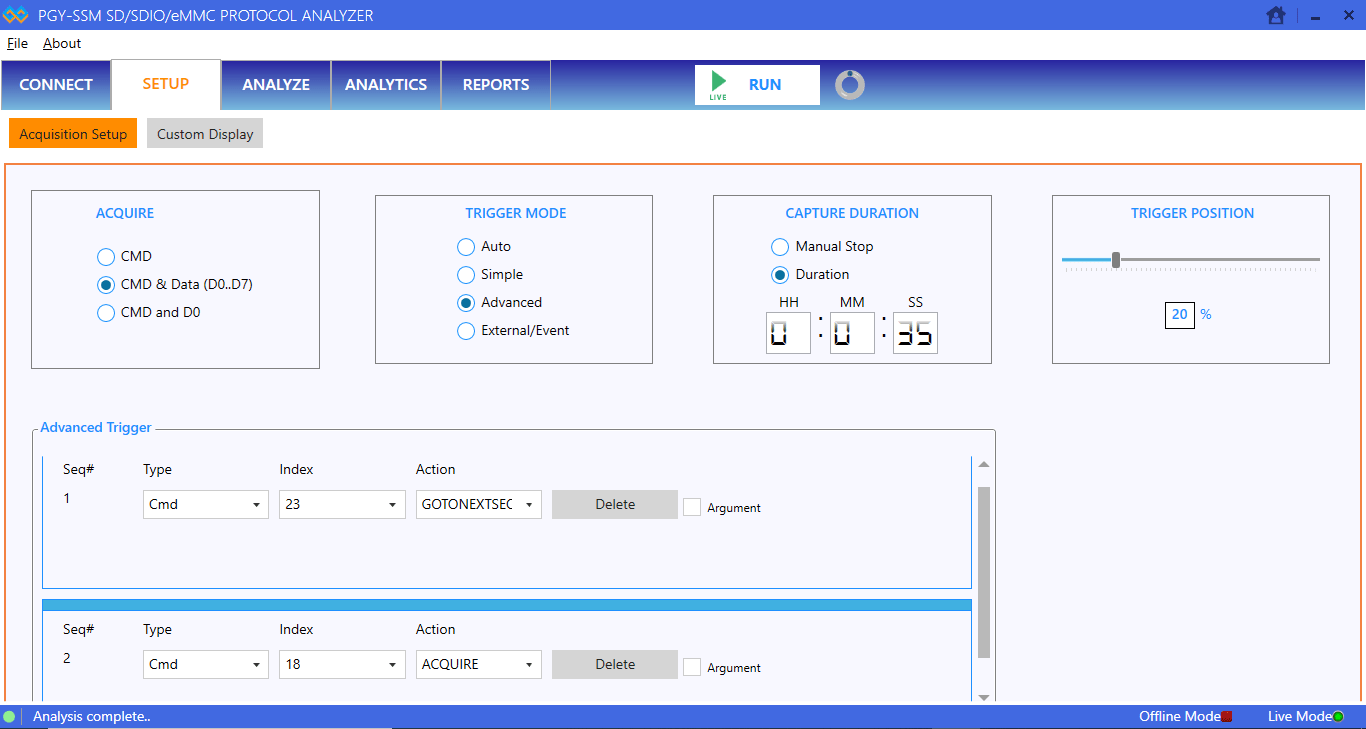
Protocol Data Capture and Trigger
PGY-SSM Protocol Analyzer has powerful protocol-aware trigger capabilities that allow the capture of protocol events at specific events. PGY-SSM supports simple and advanced trigger capabilities. PGY-SSM can trigger specific command, response, and CRC error conditions. Advanced trigger capabilities allow sequential trigger conditions to capture protocol data after a sequence of events. In Auto mode, data is captured by pressing the RUN button.
Protocol data capture duration is controlled by manual stop or setting the capture duration. Manual stop offers the flexibility of set protocol data capture by visual activities in DUT. In time duration user set data capture in secs to 3 to 4 hours. During the capture mode, protocol data is continuously streamed to the host system hard disk drive for storage.
Analytics
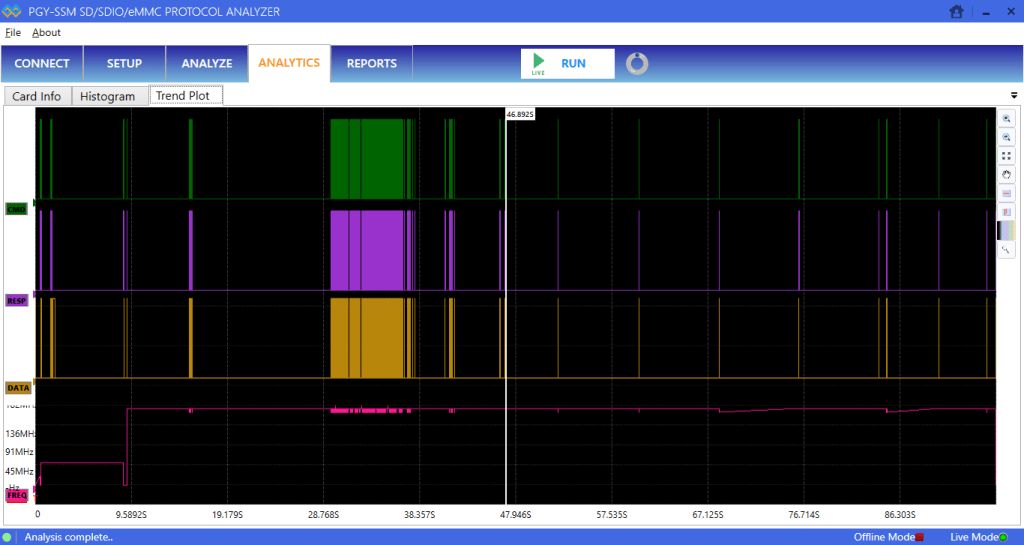
1. Analytics features quickly provide insight into protocol activity without going through the complete protocol activity. An ample plot is shown below:
The Analytics view is a bird’s eye view of protocol activity for the captured long-duration data. It reduces analysis time by viewing plot command; response, data, and frequency of operation of captured data. The user can search for specific commands or responses in the plot.
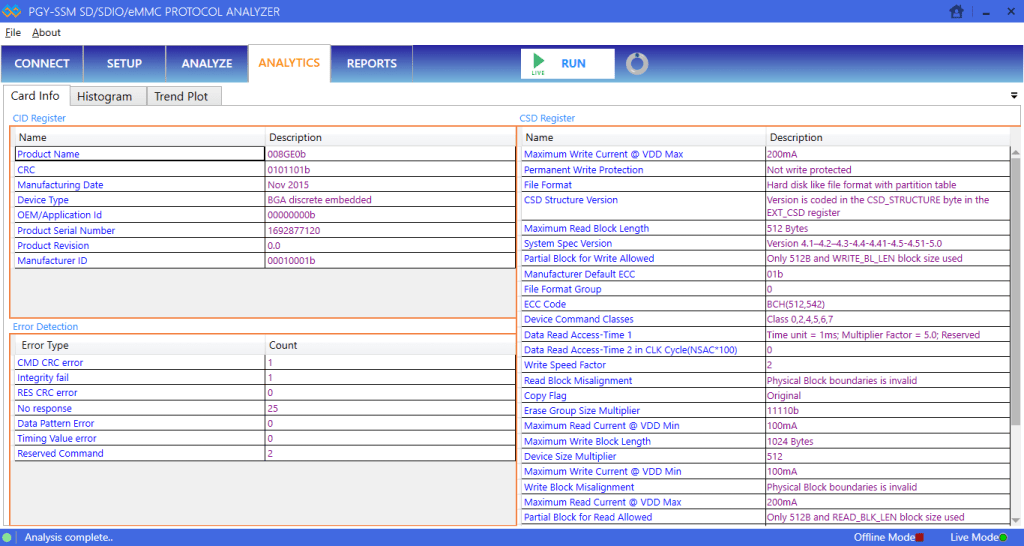
Analytics
2. Card/Device Information provides decoding of register argument of device. Now the user no longer needs to manually decode each register value.
Host Machine Minimum Requirements: Microsoft Windows® 8, Windows 7, 16GB of RAM; Storage with at least 50 GB HDD space for storing the acquired data. Display with a resolution of at least 1024×768.
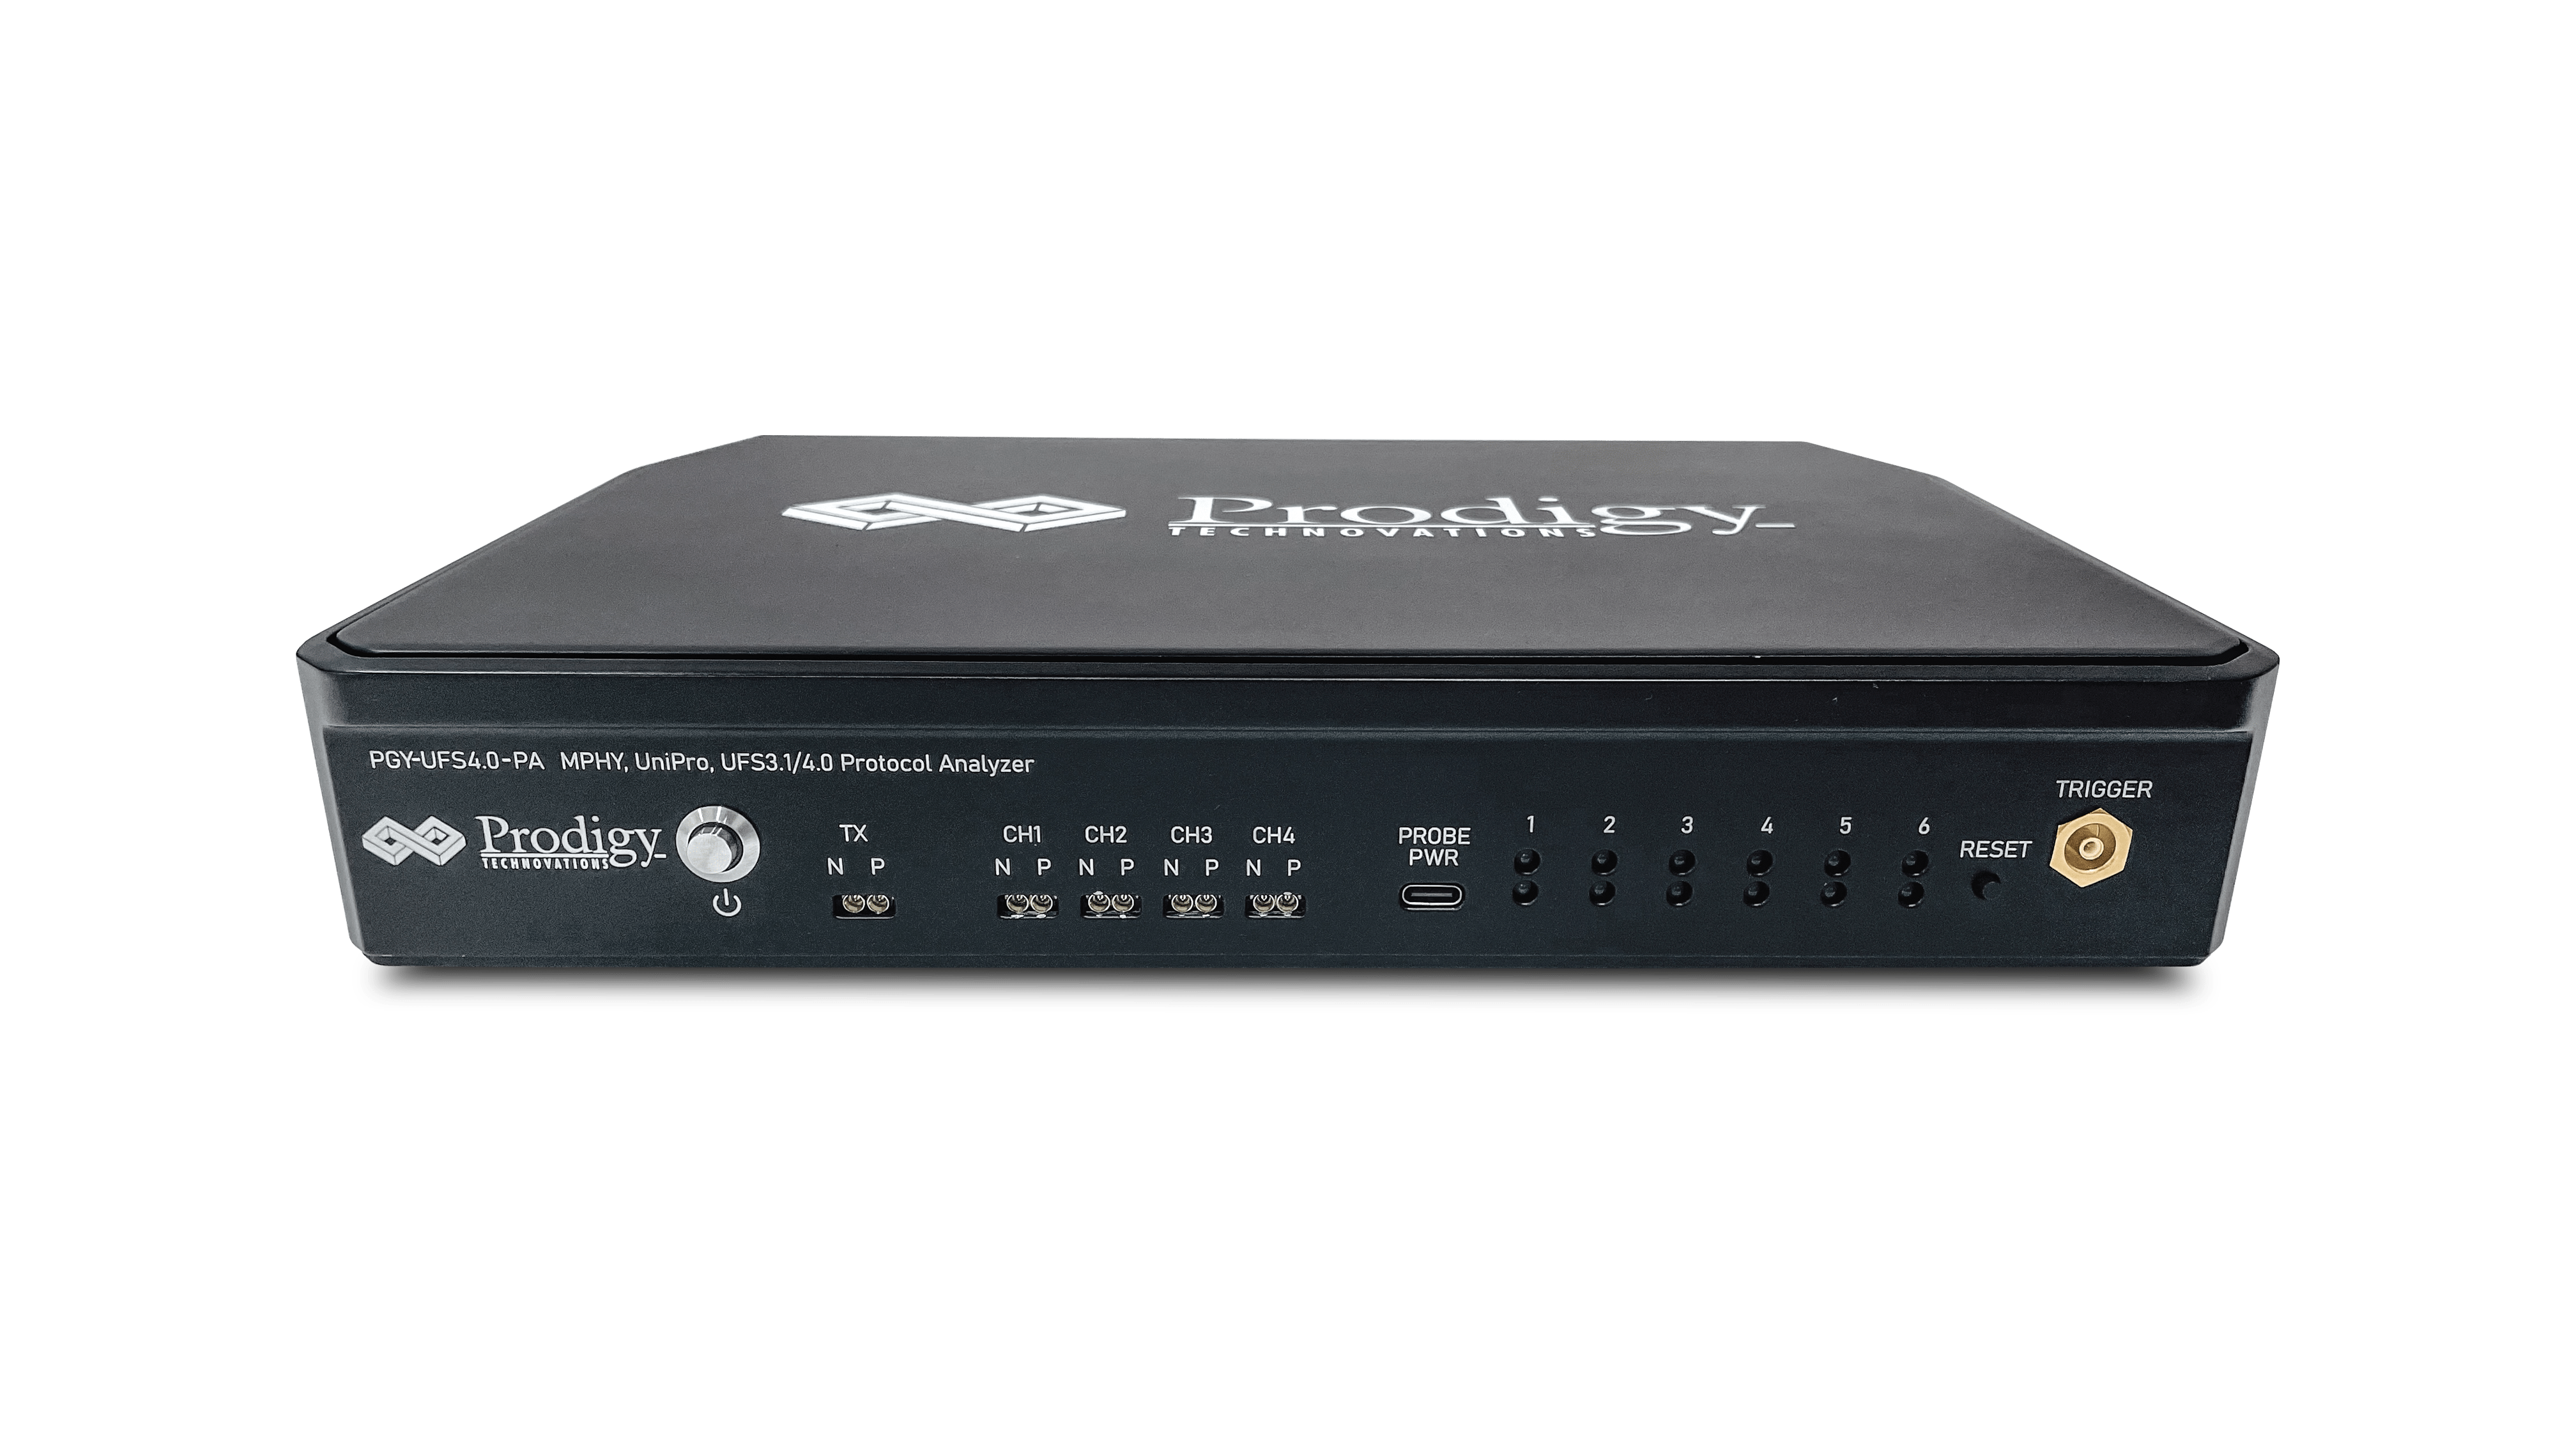
PGY-UFS4.0-PA, UFS Protocol Analyzer is the industry-first working and tested UFS4.0 Protocol Analyzer. It offers protocol data capture and debugging of data across MPHY, UniPro, and UFS protocol layers…