0
U.S. (TOLL FREE)
+1 (315) 215-3225
Automative

0
U.S. (TOLL FREE)
+1 (315) 215-3225
Cell Therapy Market by Cell Type (Stem Cell and Non-Stem Cell), Therapy Type (Autologous and Allogenic), Therapeutic Area (Malignancies, Musculoskeletal Disorders, Autoimmune Disorders, Dermatology, and Others), and End User (Hospitals & Clinics and Academic & Research Institutes): Global Opportunity Analysis and Industry Forecast, 2020–2027
Published Date: September 2020
|
Report Code: ALLI-Auto-0E377
Home | Market Reports | Health| Health Foundations & Medical Research
Cell Therapy Market by Cell Type Stem Cell and Non Stem Cell Therapy Type Autologous and Allogenic Therapeutic Area Malignancies Musculoskeletal Disorders Autoimmune Disorders Dermatology and Others and End User Hospitals Clinics and Academic Research Institutes Global Opportunity Analysis and Industry Forecast 2020 2027
BUY CHAPTERS

Cell Therapy Market by Cell Type (Stem Cell and Non-Stem Cell), Therapy Type (Autologous and Allogenic), Therapeutic Area (Malignancies, Musculoskeletal Disorders, Autoimmune Disorders, Dermatology, and Others), and End User (Hospitals & Clinics and Academic & Research Institutes): Global Opportunity Analysis and Industry Forecast, 2020–2027

Code: ALLI-Auto-0E377
Report
September 2020
Pages:241
Allied Market Research
Buy Now with 15% Discount
DESCRIPTION
TABLE OF CONTENT
TABLES & FIGURES

Cell Therapy Market Statistics 2027

The global cell therapy market accounted for USD 7,754.89 Million in 2019, and is expected to reach USD 48,115.40 Million by 2027, registering a CAGR of 25.6% from 2020 to 2027. Rise in prevalence of population suffering from cardiovascular, cancer, and other diseases is expected to positively affect growth of the market.
 
Cell therapy market

What is Cell Therapy?

Cell therapy is a technology that relies on replacing diseased or dysfunctional cells with healthy functioning ones. Cells mainly used for such advanced therapies are stem cells, owingtotheir ability to differentiate into specific cells required for repairing damaged or defective tissues or cells. Moreover, cell therapy finds its application in development of regenerative medicines, which is a multidisciplinary area aimed at maintenance, improvement, or restoration of cell, tissue, or organ function using methods mainly related to cell therapy. In addition, cells such as blood and bone marrow cells, mature, immature & solid tissue cells, adult stem cells, and embryonic stem cellsare widely used in cell therapy procedures. Moreover, transplanted cells including induced pluripotent stem cells (iPSCs), embryonic stem cells (ESCs), neural stem cells (NSCs), and mesenchymal stem cells (MSCs) are divided broadly into two main groups including autologous cell therapy and non-autologous cell therapy.
 
Cell Therapy Market Size
 
The cell therapy market is negatively impacted by the pandemic as most countries adopted lockdown to combat the pandemic. In addition, most clinics across the globe have stopped undertaking new cases of stem cell therapy, organ transplant,and other treatments for next few months, till the conditions seem to be under control.In addition, biopharmaceutical companies, including major players such as Pfizer and Eli Lilly have also announced clinical trial delays. The impact on allogeneic cell therapies or cell therapies derived from a healthy donor areparticularly acute. Moreover, owing to social distancing restrictions, allogeneic donors are less likely and often unable to donate their cells. This causes delays in cell collection that ripple throughout an entire allogeneic cell therapy process. As continued evaluation of COVID-19 cases underscores that people with underlying conditions are disproportionately affected by the virus, many patients whose therapeutic need is not immediate are choosing to wait rather than risk exposure. Furthermore, patients are being prioritized according to risk and need at this time. Various country and region-specific conditions are being put in place to allow treatment and trials to continue, however, many existing trials and read outs have been delayed and new trials completely suspended.

Cell Therapy Market Trends

Rise in adoption of human cells for cell therapeutics research, technological advancements in field of cell therapy, and increase in incidences of diseases such as cancer and cardiac abnormalities are the key factors that drive growth of the market.
 
Cell Therapy market by cell type
On the contrary, surge in number of regulations to promote stem cell therapy and increase in funds for research in developing countries are expected to offer lucrative opportunities forthe market in the future. Moreover, increase in initiatives taken by authorities and governments to improve healthcare systems and spread awareness regarding benefits of cell therapyare also expected to increase growth of the global market. 

Cell Therapy Market Share

Furthermore, increase in financing and investments to support launch of new companies is expected to boost organic revenue growth ofthe market. For instance, in July 2019, Bayer invested USD 215 Million for launch of Century Therapeutics, a U.S.-based biotechnology startup that aimed at developing therapies for solid tumors and blood cancer. Funding was further increased to USD 250 Billion by a USD 35 Mmillion contribution from Versant Ventures and Fujifilm Cellular Dynamics, which is anticipated to further boost the market growth.
Cell Therapy market by Therapy type
 
Inception of effective guidelines for cell therapy manufacturing, development of advanced genomic analysis techniques, vast number of researches by cancer societies, and proven effectiveness of transplants are some of the primary growth factorsof the cell therapy market.According to the transplantation statistics 2019, in the U.S., each year, approximately 18,000 people, aged 0 to 74 years, benefit from a potentially life-saving bone marrow or umbilical cord blood transplant. Furthermore, Asia-Pacific exhibits high potential for growth in the market as it constituted around 4.60 billion of the global human population in 2019, which can serve as a potential patient base. Moreover, developing countries such as India and China are expected to experience growth, owing to surge in healthcare infrastructure, increase in affordability, and rise in awareness related to cell therapy.

Cell Therapy Market Segmentation

The cell therapy market is segmented on the basis of cell type, therapy type, therapeutic area, enduser, and region. On the basis cell type, the market is categorized into stem cell and non-stem cell. By therapy type, it is categorized into autologous and allogenic. By therapeutic area, the market is categorized into malignancies, musculoskeletal disorders, autoimmune disorders, dermatology, and others. By enduser, it is segmented into hospitals & clinics and academic & research institutes. On the basis of region, the market is analyzed across North America (the U.S., Canada, and Mexico), Europe (Germany, the UK, France, Spain, Italy, and rest of Europe), Asia-Pacific (Japan, China, India, Australia, and rest of Asia-Pacific), and LAMEA (Brazil, South Africa, Saudi Arabia, and rest of LAMEA).

Cell Therapy Market Segment Review

On the basis of cell type, the stem cell segment dominated the global cell therapy market in 2019, and is anticipated to continue this trend throughout the forecast period, as these are gaining popularity from initiatives taken by various governments. The number of stem cell banks are on the risein developing nations, which further propels the cell therapy market growth. In addition, rise in awareness regarding storage of stem cells also have a positive effect on the cell therapy market. In addition, by therapy type, the allogenic therapy segment dominated the market in 2019. This therapy is advantageousasit includes production of own immune stem cells, which could kill cancer cells that remain even after high-dose cytotoxic drugs treatment. Patients, who have a high risk of relapse after successful treatment of chemotherapy are recommended allogeneic transplants. Thus, rise in cases of cancer relapse fuels demand for allogeneic therapy in the global market. By therapeutic area, the malignancies segment is anticipated to dominate the global market during the forecast period. Surge in cancer research, rise in geriatric population worldwide, and increase in adoption of cell therapy for treatment of malignancies are major factorsthat boost the cell therapy market growth.

By end user, the hospitals & clinics segment are forecasted to grow at thehighest CAGR during the forecast period. The lucrative growth of the segment is attributed to increase in number of pipeline projects over the past few years. As per the Cancer Research Institute (CRI), number of cell therapy treatment projects increased from 753 in 2018 to 1,011 in 2019.

Asia-Pacific presents lucrative opportunities for key players operating in the cell therapy market, owing to increase in population, coupled with high growing geriatric population and growth in awareness among healthcare entities and patients pertaining to potential of these therapies in chronic disease management. In addition, rise in healthcare expenditure and developing guidelines are expected to propelthe market growth in the region.

The report provides a comprehensive analysis of the leading companies operating in the global cell therapy market are Kolon Tissue Gene, Inc., Osiris Therapeutics, Inc., JCR Pharmaceuticals Co. Ltd., NuVasive, Inc., Stemedica Cell Technologies, Inc., Cells for cells, HolostemTerapieAvanzateS.r.l., Mesoblast Ltd., and Medipost Co., Ltd.

Key Benefits for Stakeholders

  • The report provides an extensive analysis of the cell therapy market size, current market trends and future estimations of the cell therapy market.
  • The cell therapy analysis is comprehensively covered with respect to the component, application, and region.
  • The cell therapy estimations in this report are based on high-end analysis of the key developments for 2019–2027.
  • Recent developments, key manufacturers, and top player positioning are listed in this report to analyze the competitive scenario of the cell therapy market.
 
  • By End User

    • Hospitals & Clinics
    • Academic & Research Institutes
  • Therapy Type

    • Autologous
    • Allogeneic
  • Therapeutic Area

    • Malignancies
    • Musculoskeletal Disorders
    • Autoimmune Disorders
    • Dermatology
    • Others
  • By Cell Type

    • Stem Cell
      • Bone Marrow
      • Blood
      • Umbilical Cord-Derived
      • Adipose-Derived Stem Cell
      • .Others (placenta, and nonspecific cells)
    • Non-stem Cell
  • By Region

    • North America
      • U.S.
      • Canada
      • Mexico
    • Europe
      • UK
      • Germany
      • France
      • Spain
      • Italy
      • Rest of Europe
    • Asia-Pacific
      • Japan
      • India
      • China
      • Australia
      • Rest of Asia-Pacific
    • LAMEA
      • Brazil
      • Saudi Arabia
      • South Africa
      • Rest of LAMEA

Key Companies

  • ALLOSOURCE
  • CELLS FOR CELLS
  • HOLOSTEM TERAPIE AVANZATE SRL
  • JCR PHARMACEUTICALS CO., LTD.
  • KOLON TISSUEGENE, INC.
  • MEDIPOST CO., LTD.
  • MESOBLAST LTD
  • NUVASIVE, INC.
  • OSIRIS THERAPEUTICS, INC.
  • STEMEDICA CELL TECHNOLOGIES, INC

Scope of Cell Therapy Market Report

Report Metric

Details

Report Name

Cell Therapy Market

Market size value in 2019

USD 7,754.89 Million

Revenue forecast in 2027

USD 48,115.40 Million

Growth Rate

CAGR of 25.6%

Base Year Considered

2019

Forecast Period

2020 - 2027

By Cell Type

Stem Cell and Non-Stem Cell

Therapy Type

Autologous and Allogenic

Therapeutic Area

Malignancies, Musculoskeletal Disorders, Autoimmune Disorders, Dermatology, and Others

End Users

Hospitals & Clinics and Academic & Research Institutes

Frequently Asked Questions About This Report

1. How big is the Cell Therapy Market?

Ans. The global cell therapy market accounted for $7,754.89 million in 2019, and is expected to reach $48,115.40 million by 2027, registering a CAGR of 25.6% from 2020 to 2027.

2. What are the major factors that drives the growth of cell therapy market?

Ans. Rise in adoption of human cells for cell therapeutics research, technological advancements in field of cell therapy, and increase in incidences of diseases such as cancer and cardiac abnormalities are the key factors that drive growth of the market.

3. Which region holds largest market share in the Cell therapy industry?

Ans. Asia-Pacific region would exhibit the highest CAGR of 31.6% during 2020-2027.

4. Who are the key companies available in the Cell therapy industry?

Ans. Some of the major companies are Kolon Tissue Gene, Inc., Osiris Therapeutics, Inc., JCR Pharmaceuticals Co. Ltd., NuVasive, Inc., Stemedica Cell Technologies, Inc., Cells for cells, HolostemTerapieAvanzateS.r.l., Mesoblast Ltd., and Medipost Co., Ltd.

CHAPTER 1:INTRODUCTION
1.1.Report description
1.2.Key benefits for stakeholders
1.3.Key market segments
1.4.Research methodology
1.4.1.Secondary research
1.4.2.Primary research
1.4.3.Analyst tools & models
CHAPTER 2:EXECUTIVE SUMMARY
2.1.Key findings of the study
2.2.CXO perspective
CHAPTER 3:MARKET OVERVIEW
3.1.Market definition and scope
3.2.Key findings
3.2.1.Top player positioning
3.2.2.Top investment pockets
3.2.3.Top winning strategies
3.3.Porter’s five forces analysis
3.4.Impact Analysis
3.4.1.Drivers
3.4.1.1.Technological advancements in the field of cell therapy
3.4.1.2.Rise in number of cell therapy clinical studies
3.4.1.3.Rise in adoption of regenerative medicine
3.4.2.Restraint
3.4.2.1.Developing stage and pricing
3.4.3.Opportunity
3.4.3.1.High growth potential in emerging markets
3.5.Impact of COVID-19 on cell therapy market
CHAPTER 4:CELL THERAPY MARKET, BY CELL TYPE
4.1.Overview
4.1.1.Market size and forecast
4.2.Stem cell
4.2.1.Key market trends and opportunities
4.2.2.Market size and forecast, by region
4.2.3.Market size and forecast, by type
4.2.3.1.Bone marrow, market size and forecast
4.2.3.2.Blood, market size and forecast
4.2.3.3.Umbilical cord-derived, market size and forecast
4.2.3.4.Adipose-derived stem cell, market size and forecast
4.2.3.5.Others (placenta, and nonspecific cells), market size and forecast
4.3.Non-stem cell
4.3.1.Key market trends and opportunities
4.3.2.Market size and forecast, by region
CHAPTER 5:CELL THERAPY MARKET, BY THERAPY TYPE
5.1.Overview
5.1.1.Market size and forecast
5.2.Autologous
5.2.1.Key market trends and opportunities
5.2.2.Market size and forecast, by region
5.2.3.Market analysis, by country
5.3.Allogeneic
5.3.1.Key market trends and opportunities
5.3.2.Market size and forecast, by region
5.3.3.Market analysis, by country
CHAPTER 6:CELL THERAPY MARKET, BY THERAPEUTIC AREA
6.1.Overview
6.1.1.Market size and forecast
6.2.Malignancies
6.2.1.Market size and forecast, by region
6.2.2.Market analysis, by country
6.3.Musculoskeletal disorders
6.3.1.Market size and forecast, by region
6.3.2.Market analysis, by country
6.4.Autoimmune disorders
6.4.1.Market size and forecast, by region
6.4.2.Market analysis, by country
6.5.Dermatology
6.5.1.Market size and forecast, by region
6.5.2.Market analysis, by country
6.6.Others
6.6.1.Market size and forecast, by region
6.6.2.Market analysis, by country
CHAPTER 7:CELL THERAPY MARKET, BY END USER
7.1.Overview
7.1.1.Market size and forecast
7.2.Hospitals & clinics
7.2.1.Key market trends and opportunities
7.2.2.Market size and forecast, by region
7.2.3.Market analysis, by country
7.3.Academic & Research Institutes
7.3.1.Key market trends and opportunities
7.3.2.Market size and forecast, by region
7.3.3.Market analysis, by country
CHAPTER 8:CELL THERAPY MARKET, BY REGION
8.1.Overview
8.1.1.Market size and forecast
8.2.North America
8.2.1.Key market trends and opportunities
8.2.2.Market size and forecast
8.2.3.Market size and forecast, by cell type
8.2.4.Market size and forecast, by therapy type
8.2.5.Market size and forecast, by therapeutic area
8.2.6.Market size and forecast, by end user
8.2.6.1.U.S. market size and forecast
8.2.6.1.1.Market size and forecast, by cell type
8.2.6.1.2.Market size and forecast, by therapy type
8.2.6.1.3.Market size and forecast, by therapeutic area
8.2.6.1.4.Market size and forecast, by end user
8.2.6.2.Canada market size and forecast
8.2.6.2.1.Market size and forecast, by cell type
8.2.6.2.2.Market size and forecast, by therapy type
8.2.6.2.3.Market size and forecast, by therapeutic area
8.2.6.2.4.Market size and forecast, by end user
8.2.6.3.Mexico market size and forecast
8.2.6.3.1.Market size and forecast, by cell type
8.2.6.3.2.Market size and forecast, by therapy type
8.2.6.3.3.Market size and forecast, by therapeutic area
8.2.6.3.4.Market size and forecast, by end user
8.3.Europe
8.3.1.Key market trends and opportunities
8.3.2.Market size and forecast
8.3.3.Market size and forecast, by cell type
8.3.4.Market size and forecast, by therapy type
8.3.5.Market size and forecast, by therapeutic area
8.3.6.Market size and forecast, by end user
8.3.6.1.UK market size and forecast
8.3.6.1.1.Market size and forecast, by cell type
8.3.6.1.2.Market size and forecast, by therapy type
8.3.6.1.3.Market size and forecast, by therapeutic area
8.3.6.1.4.Market size and forecast, by end user
8.3.6.2.Germany market size and forecast
8.3.6.2.1.Market size and forecast, by cell type
8.3.6.2.2.Market size and forecast, by therapy type
8.3.6.2.3.Market size and forecast, by therapeutic area
8.3.6.2.4.Market size and forecast, by end user
8.3.6.3.France market size and forecast
8.3.6.3.1.Market size and forecast, by cell type
8.3.6.3.2.Market size and forecast, by therapy type
8.3.6.3.3.Market size and forecast, by therapeutic area
8.3.6.3.4.Market size and forecast, by end user
8.3.6.4.Spain market size and forecast
8.3.6.4.1.Market size and forecast, by cell type
8.3.6.4.2.Market size and forecast, by therapy type
8.3.6.4.3.Market size and forecast, by therapeutic area
8.3.6.4.4.Market size and forecast, by end user
8.3.6.5.Italy market size and forecast
8.3.6.5.1.Market size and forecast, by cell type
8.3.6.5.2.Market size and forecast, by therapy type
8.3.6.5.3.Market size and forecast, by therapeutic area
8.3.6.5.4.Market size and forecast, by end user
8.3.6.6.Rest of Europe market size and forecast
8.3.6.6.1.Market size and forecast, by cell type
8.3.6.6.2.Market size and forecast, by therapy type
8.3.6.6.3.Market size and forecast, by therapeutic area
8.3.6.6.4.Market size and forecast, by end user
8.4.Asia-Pacific
8.4.1.Key market trends and opportunities
8.4.2.Market size and forecast
8.4.3.Market size and forecast, by cell type
8.4.4.Market size and forecast, by therapy type
8.4.5.Market size and forecast, by therapeutic area
8.4.6.Market size and forecast, by end user
8.4.6.1.Japan market size and forecast
8.4.6.1.1.Market size and forecast, by cell type
8.4.6.1.2.Market size and forecast, by therapy type
8.4.6.1.3.Market size and forecast, by therapeutic area
8.4.6.1.4.Market size and forecast, by end user
8.4.6.2.India market size and forecast
8.4.6.2.1.Market size and forecast, by cell type
8.4.6.2.2.Market size and forecast, by therapy type
8.4.6.2.3.Market size and forecast, by therapeutic area
8.4.6.2.4.Market size and forecast, by end user
8.4.6.3.China market size and forecast
8.4.6.3.1.Market size and forecast, by cell type
8.4.6.3.2.Market size and forecast, by therapy type
8.4.6.3.3.Market size and forecast, by therapeutic area
8.4.6.3.4.Market size and forecast, by end user
8.4.6.4.Australia market size and forecast
8.4.6.4.1.Market size and forecast, by cell type
8.4.6.4.2.Market size and forecast, by therapy type
8.4.6.4.3.Market size and forecast, by therapeutic area
8.4.6.4.4.Market size and forecast, by end user
8.4.6.5.Rest of Asia-Pacific market size and forecast
8.4.6.5.1.Market size and forecast, by cell type
8.4.6.5.2.Market size and forecast, by therapy type
8.4.6.5.3.Market size and forecast, by therapeutic area
8.4.6.5.4.Market size and forecast, by end user
8.5.LAMEA
8.5.1.Key market trends and opportunities
8.5.2.Market size and forecast
8.5.3.Market size and forecast, by cell type
8.5.4.Market size and forecast, by therapy type
8.5.5.Market size and forecast, by therapeutic area
8.5.6.Market size and forecast, by end user
8.5.6.1.Brazil market size and forecast
8.5.6.1.1.Market size and forecast, by cell type
8.5.6.1.2.Market size and forecast, by therapy type
8.5.6.1.3.Market size and forecast, by therapeutic area
8.5.6.1.4.Market size and forecast, by end user
8.5.6.2.Saudi Arabia market size and forecast
8.5.6.2.1.Market size and forecast, by cell type
8.5.6.2.2.Market size and forecast, by therapy type
8.5.6.2.3.Market size and forecast, by therapeutic area
8.5.6.2.4.Market size and forecast, by end user
8.5.6.3.South Africa market size and forecast
8.5.6.3.1.Market size and forecast, by cell type
8.5.6.3.2.Market size and forecast, by therapy type
8.5.6.3.3.Market size and forecast, by therapeutic area
8.5.6.3.4.Market size and forecast, by end user
8.5.6.4.Rest of LAMEA market size and forecast
8.5.6.4.1.Market size and forecast, by cell type
8.5.6.4.2.Market size and forecast, by therapy type
8.5.6.4.3.Market size and forecast, by therapeutic area
8.5.6.4.4.Market size and forecast, by end user
CHAPTER 9:COMPANY PROFILES
9.1.ALLOSOURCE
9.1.1.Company overview
9.1.2.Company snapshot
9.1.3.Operating business segments
9.1.4.Product portfolio
9.1.5.Key strategic moves and developments
9.2.CELLS FOR CELLS
9.2.1.Company overview
9.2.2.Company snapshot
9.2.3.Operating business segments
9.2.4.Product portfolio
9.3.HOLOSTEM TERAPIE AVANZATE SRL
9.3.1.Company overview
9.3.2.Company snapshot
9.3.3.Operating business segments
9.3.4.Product portfolio
9.4.JCR PHARMACEUTICALS CO., LTD.
9.4.1.Company overview
9.4.2.Company snapshot
9.4.3.Operating business segments
9.4.4.Product portfolio
9.4.5.Business performance
9.4.6.Key strategic moves and developments
9.5.KOLON TISSUEGENE, INC.
9.5.1.Company overview
9.5.2.Company snapshot
9.5.3.Operating business segments
9.5.4.Product portfolio
9.5.5.Key strategic moves and developments
9.6.MEDIPOST CO., LTD.
9.6.1.Company overview
9.6.2.Company snapshot
9.6.3.Operating business segments
9.6.4.Product portfolio
9.6.5.Business performance
9.7.MESOBLAST LTD
9.7.1.Company overview
9.7.2.Company snapshot
9.7.3.Operating business segments
9.7.4.Product portfolio
9.7.5.Business performance
9.8.NUVASIVE, INC.
9.8.1.Company overview
9.8.2.Company snapshot
9.8.3.Operating business segments
9.8.4.Product portfolio
9.8.5.Business performance
9.9.OSIRIS THERAPEUTICS, INC.
9.9.1.Company overview
9.9.2.Company snapshot
9.9.3.Operating business segments
9.9.4.Product portfolio
9.10.STEMEDICA CELL TECHNOLOGIES, INC.
9.10.1.Company overview
9.10.2.Company snapshot
9.10.3.Operating business segments
            9.10.4.Product portfoli0
LIST OF TABLES

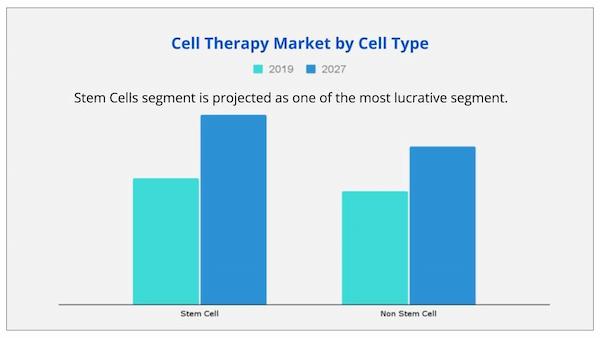
TABLE 01.CELL THERAPY MARKET, BY CELL TYPE, 2019–2027 ($MILLION)
TABLE 02.CELL THERAPY MARKET FOR STEM CELL, BY REGION, 2019–2027 ($MILLION)
TABLE 03.CELL THERAPY MARKET FOR STEM CELL, BY TYPE, 2019–2027 ($MILLION)
TABLE 04.CELL THERAPY MARKET FOR NON-STEM CELL, BY REGION, 2019–2027 ($MILLION)
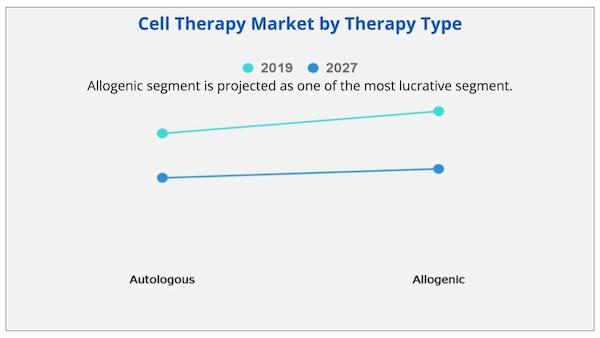
TABLE 05.CELL THERAPY MARKET, BY THERAPY TYPE, 2019–2027 ($MILLION)
TABLE 06.CELL THERAPY MARKET FOR AUTOLOGOUS, BY REGION, 2019–2027 ($MILLION)
TABLE 07.CELL THERAPY MARKET FOR ALLOGENEIC, BY REGION, 2019–2027 ($MILLION)
TABLE 08.CELL THERAPY MARKET, BY THERAPEUTIC AREA, 2019–2027 ($MILLION)
TABLE 09.CELL THERAPY MARKET FOR MALIGNANCIES, BY REGION, 2019–2027 ($MILLION)
TABLE 10.CELL THERAPY MARKET FOR MUSCULOSKELETAL DISORDERS, BY REGION, 2019–2027 ($MILLION)
TABLE 11.CELL THERAPY MARKET FOR AUTOIMMUNE DISORDERS, BY REGION, 2019–2027 ($MILLION)
TABLE 12.CELL THERAPY MARKET FOR DERMATOLOGY, BY REGION, 2019–2027 ($MILLION)
TABLE 13.CELL THERAPY MARKET FOR OTHERS, BY REGION, 2019–2027 ($MILLION)
TABLE 14.CELL THERAPY MARKET, BY END USER, 2019–2027 ($MILLION)
TABLE 15.CELL THERAPY MARKET FOR HOSPITALS & CLINICS, BY REGION, 2019–2027 ($MILLION)
TABLE 16.CELL THERAPY MARKET FOR ACADEMIC & RESEARCH INSTITUTES, BY REGION, 2019–2027 ($MILLION)
TABLE 17.CELL THERAPY MARKET, BY REGION, 2019–2027 ($MILLION)
TABLE 18.NORTH AMERICA CELL THERAPY MARKET, 2019–2027 ($MILLION)
TABLE 19.NORTH AMERICA CELL THERAPY MARKET, BY CELL TYPE, 2019–2027 ($MILLION)
TABLE 20.NORTH AMERICA CELL THERAPY MARKET, BY THERAPY TYPE, 2019–2027 ($MILLION)
TABLE 21.NORTH AMERICA CELL THERAPY MARKET, BY THERAPEUTIC AREA, 2019–2027 ($MILLION)
TABLE 22.NORTH AMERICA CELL THERAPY MARKET, BY END USER, 2019–2027 ($MILLION)
TABLE 23.U.S. CELL THERAPY MARKET, BY CELL TYPE, 2019–2027 ($MILLION)
TABLE 24.U.S. CELL THERAPY MARKET, BY THERAPY TYPE, 2019–2027 ($MILLION)
TABLE 25.U.S. CELL THERAPY MARKET, BY THERAPEUTIC AREA, 2019–2027 ($MILLION)
TABLE 26.U.S. CELL THERAPY MARKET, BY END USER, 2019–2027 ($MILLION)
TABLE 27.CANADA CELL THERAPY MARKET, BY CELL TYPE, 2019–2027 ($MILLION)
TABLE 28.CANADA CELL THERAPY MARKET, BY THERAPY TYPE, 2019–2027 ($MILLION)
TABLE 29.CANADA CELL THERAPY MARKET, BY THERAPEUTIC AREA, 2019–2027 ($MILLION)
TABLE 30.CANADA CELL THERAPY MARKET, BY END USER, 2019–2027 ($MILLION)
TABLE 31.MEXICO CELL THERAPY MARKET, BY CELL TYPE, 2019–2027 ($MILLION)
TABLE 32.MEXICO CELL THERAPY MARKET, BY THERAPY TYPE, 2019–2027 ($MILLION)
TABLE 33.MEXICO CELL THERAPY MARKET, BY THERAPEUTIC AREA, 2019–2027 ($MILLION)
TABLE 34.MEXICO CELL THERAPY MARKET, BY END USER, 2019–2027 ($MILLION)
TABLE 35.EUROPE CELL THERAPY MARKET, 2019–2027 ($MILLION)
TABLE 36.EUROPE CELL THERAPY MARKET, BY CELL TYPE, 2019–2027 ($MILLION)
TABLE 37.EUROPE CELL THERAPY MARKET, BY THERAPY TYPE, 2019–2027 ($MILLION)
TABLE 38.EUROPE CELL THERAPY MARKET, BY THERAPEUTIC AREA, 2019–2027 ($MILLION)
TABLE 39.EUROPE CELL THERAPY MARKET, BY END USER, 2019–2027 ($MILLION)
TABLE 40.UK CELL THERAPY MARKET, BY CELL TYPE, 2019–2027 ($MILLION)
TABLE 41.UK CELL THERAPY MARKET, BY THERAPY TYPE, 2019–2027 ($MILLION)
TABLE 42.UK CELL THERAPY MARKET, BY THERAPEUTIC AREA, 2019–2027 ($MILLION)
TABLE 43.UK CELL THERAPY MARKET, BY END USER, 2019–2027 ($MILLION)
TABLE 44.GERMANY CELL THERAPY MARKET, BY CELL TYPE, 2019–2027 ($MILLION)
TABLE 45.GERMANY CELL THERAPY MARKET, BY THERAPY TYPE, 2019–2027 ($MILLION)
TABLE 46.GERMANY CELL THERAPY MARKET, BY THERAPEUTIC AREA, 2019–2027 ($MILLION)
TABLE 47.GERMANY CELL THERAPY MARKET, BY END USER, 2019–2027 ($MILLION)
TABLE 48.FRANCE CELL THERAPY MARKET, BY CELL TYPE, 2019–2027 ($MILLION)
TABLE 49.FRANCE CELL THERAPY MARKET, BY THERAPY TYPE, 2019–2027 ($MILLION)
TABLE 50.FRANCE CELL THERAPY MARKET, BY THERAPEUTIC AREA, 2019–2027 ($MILLION)
TABLE 51.FRANCE CELL THERAPY MARKET, BY END USER, 2019–2027 ($MILLION)
TABLE 52.SPAIN CELL THERAPY MARKET, BY CELL TYPE, 2019–2027 ($MILLION)
TABLE 53.SPAIN CELL THERAPY MARKET, BY THERAPY TYPE, 2019–2027 ($MILLION)
TABLE 54.SPAIN CELL THERAPY MARKET, BY THERAPEUTIC AREA, 2019–2027 ($MILLION)
TABLE 55.SPAIN CELL THERAPY MARKET, BY END USER, 2019–2027 ($MILLION)
TABLE 56.ITALY CELL THERAPY MARKET, BY CELL TYPE, 2019–2027 ($MILLION)
TABLE 57.ITALY CELL THERAPY MARKET, BY THERAPY TYPE, 2019–2027 ($MILLION)
TABLE 58.ITALY CELL THERAPY MARKET, BY THERAPEUTIC AREA, 2019–2027 ($MILLION)
TABLE 59.ITALY CELL THERAPY MARKET, BY END USER, 2019–2027 ($MILLION)
TABLE 60.REST OF EUROPE CELL THERAPY MARKET, BY CELL TYPE, 2019–2027 ($MILLION)
TABLE 61.REST OF EUROPE CELL THERAPY MARKET, BY THERAPY TYPE, 2019–2027 ($MILLION)
TABLE 62.REST OF EUROPE CELL THERAPY MARKET, BY THERAPEUTIC AREA, 2019–2027 ($MILLION)
TABLE 63.REST OF EUROPE CELL THERAPY MARKET, BY END USER, 2019–2027 ($MILLION)
TABLE 64.ASIA-PACIFIC CELL THERAPY MARKET, 2019–2027 ($MILLION)
TABLE 65.ASIA-PACIFIC CELL THERAPY MARKET, BY CELL TYPE, 2019–2027 ($MILLION)
TABLE 66.ASIA-PACIFIC CELL THERAPY MARKET, BY THERAPY TYPE, 2019–2027 ($MILLION)
TABLE 67.ASIA-PACIFIC CELL THERAPY MARKET, BY THERAPEUTIC AREA, 2019–2027 ($MILLION)
TABLE 68.ASIA-PACIFIC CELL THERAPY MARKET, BY END USER, 2019–2027 ($MILLION)
TABLE 69.JAPAN CELL THERAPY MARKET, BY CELL TYPE, 2019–2027 ($MILLION)
TABLE 70.JAPAN CELL THERAPY MARKET, BY THERAPY TYPE, 2019–2027 ($MILLION)
TABLE 71.JAPAN CELL THERAPY MARKET, BY THERAPEUTIC AREA, 2019–2027 ($MILLION)
TABLE 72.JAPAN CELL THERAPY MARKET, BY END USER, 2019–2027 ($MILLION)
TABLE 73.INDIA CELL THERAPY MARKET, BY CELL TYPE, 2019–2027 ($MILLION)
TABLE 74.INDIA CELL THERAPY MARKET, BY THERAPY TYPE, 2019–2027 ($MILLION)
TABLE 75.INDIA CELL THERAPY MARKET, BY THERAPEUTIC AREA, 2019–2027 ($MILLION)
TABLE 76.INDIA CELL THERAPY MARKET, BY END USER, 2019–2027 ($MILLION)
TABLE 77.CHINA CELL THERAPY MARKET, BY CELL TYPE, 2019–2027 ($MILLION)
TABLE 78.CHINA CELL THERAPY MARKET, BY THERAPY TYPE, 2019–2027 ($MILLION)
TABLE 79.CHINA CELL THERAPY MARKET, BY THERAPEUTIC AREA, 2019–2027 ($MILLION)
TABLE 80.CHINA CELL THERAPY MARKET, BY END USER, 2019–2027 ($MILLION)
TABLE 81.AUSTRALIA CELL THERAPY MARKET, BY CELL TYPE, 2019–2027 ($MILLION)
TABLE 82.AUSTRALIA CELL THERAPY MARKET, BY THERAPY TYPE, 2019–2027 ($MILLION)
TABLE 83.AUSTRALIA CELL THERAPY MARKET, BY THERAPEUTIC AREA, 2019–2027 ($MILLION)
TABLE 84.AUSTRALIA CELL THERAPY MARKET, BY END USER, 2019–2027 ($MILLION)
TABLE 85.REST OF ASIA-PACIFIC CELL THERAPY MARKET, BY CELL TYPE, 2019–2027 ($MILLION)
TABLE 86.REST OF ASIA-PACIFIC CELL THERAPY MARKET, BY THERAPY TYPE, 2019–2027 ($MILLION)
TABLE 87.REST OF ASIA-PACIFIC CELL THERAPY MARKET, BY THERAPEUTIC AREA, 2019–2027 ($MILLION)
TABLE 88.REST OF ASIA-PACIFIC CELL THERAPY MARKET, BY END USER, 2019–2027 ($MILLION)
TABLE 89.LAMEA CELL THERAPY MARKET, 2019–2027 ($MILLION)
TABLE 90.LAMEA CELL THERAPY MARKET, BY CELL TYPE, 2019–2027 ($MILLION)
TABLE 91.LAMEA CELL THERAPY MARKET, BY THERAPY TYPE, 2019–2027 ($MILLION)
TABLE 92.LAMEA CELL THERAPY MARKET, BY THERAPEUTIC AREA, 2019–2027 ($MILLION)
TABLE 93.LAMEA CELL THERAPY MARKET, BY END USER, 2019–2027 ($MILLION)
TABLE 94.BRAZIL CELL THERAPY MARKET, BY CELL TYPE, 2019–2027 ($MILLION)
TABLE 95.BRAZIL CELL THERAPY MARKET, BY THERAPY TYPE, 2019–2027 ($MILLION)
TABLE 96.BRAZIL CELL THERAPY MARKET, BY THERAPEUTIC AREA, 2019–2027 ($MILLION)
TABLE 97.BRAZIL CELL THERAPY MARKET, BY END USER, 2019–2027 ($MILLION)
TABLE 98.SAUDI ARABIA CELL THERAPY MARKET, BY CELL TYPE, 2019–2027 ($MILLION)
TABLE 99.SAUDI ARABIA CELL THERAPY MARKET, BY THERAPY TYPE, 2019–2027 ($MILLION)
TABLE 100.SAUDI ARABIA CELL THERAPY MARKET, BY THERAPEUTIC AREA, 2019–2027 ($MILLION)
TABLE 101.SAUDI ARABIA CELL THERAPY MARKET, BY END USER, 2019–2027 ($MILLION)
TABLE 102.SOUTH AFRICA CELL THERAPY MARKET, BY CELL TYPE, 2019–2027 ($MILLION)
TABLE 103.SOUTH AFRICA CELL THERAPY MARKET, BY THERAPY TYPE, 2019–2027 ($MILLION)
TABLE 104.SOUTH AFRICA CELL THERAPY MARKET, BY THERAPEUTIC AREA, 2019–2027 ($MILLION)
TABLE 105.SOUTH AFRICA CELL THERAPY MARKET, BY END USER, 2019–2027 ($MILLION)
TABLE 106.REST OF LAMEA CELL THERAPY MARKET, BY CELL TYPE, 2019–2027 ($MILLION)
TABLE 107.REST OF LAMEA CELL THERAPY MARKET, BY THERAPY TYPE, 2019–2027 ($MILLION)
TABLE 108.REST OF LAMEA CELL THERAPY MARKET, BY THERAPEUTIC AREA, 2019–2027 ($MILLION)
TABLE 109.REST OF LAMEA CELL THERAPY MARKET, BY END USER, 2019–2027 ($MILLION)
TABLE 110.ALLOSOURCE: COMPANY SNAPSHOT
TABLE 111.ALLOSOURCE: OPERATING SEGMENTS
TABLE 112.ALLOSOURCE SA: PRODUCT PORTFOLIO
TABLE 113.CELLS FOR CELLS BLOOD SUPPLY FOUNDATION: COMPANY SNAPSHOT
TABLE 114.CELLS FOR CELLS BLOOD SUPPLY FOUNDATION: PRODUCT PORTFOLIO
TABLE 115.HOLOSTEM: COMPANY SNAPSHOT
TABLE 116.HOLOSTEM: OPERATING SEGMENTS
TABLE 117.HOLOSTEM: PRODUCT PORTFOLIO
TABLE 118.JCR PHARMACEUTICALS.: COMPANY SNAPSHOT
TABLE 119.JCR PHARMACEUTICALS.: PRODUCT PORTFOLIO
TABLE 120.KOLON TISSUEGENE: COMPANY SNAPSHOT
TABLE 121.KOLON TISSUEGENE: PRODUCT SEGMENT
TABLE 122.KOLON TISSUEGENE: PRODUCT PORTFOLIO
TABLE 123.MEDIPOST: COMPANY SNAPSHOT
TABLE 124.MEDIPOST: OPERATING SEGMENTS
TABLE 125.MEDIPOST: PRODUCT PORTFOLIO
TABLE 126.MESOBLAST: COMPANY SNAPSHOT
TABLE 127.MESOBLAST.: PRODUCT PORTFOLIO
TABLE 128.NUVASIVE: COMPANY SNAPSHOT
TABLE 129.NUVASIVE: OPERATING SEGMENTS
TABLE 130.NUVASIVE: PRODUCT PORTFOLIO
TABLE 131.OSIRIS: COMPANY SNAPSHOT
TABLE 132.OSIRIS: PRODUCT PORTFOLIO
TABLE 133.STEMEDICA: COMPANY SNAPSHOT
TABLE 134.STEMEDICA: PRODUCT PORTFOLIO LIST OF FIGURES

FIGURE 01.CELL THERAPY MARKET SEGMENTATION
FIGURE 02.TOP PLAYER POSITIONING, 2019
FIGURE 03.TOP INVESTMENT POCKETS
FIGURE 04.TOP WINNING STRATEGIES, BY YEAR, 2017–2019*
FIGURE 05.TOP WINNING STRATEGIES, BY DEVELOPMENT, 2017–2019* (%)
FIGURE 06.TOP WINNING STRATEGIES, BY COMPANY, 2017–2019*
FIGURE 07.MODERATE BARGAINING POWER OF BUYERS
FIGURE 08.MODERATE BARGAINING POWER OF SUPPLIERS
FIGURE 09.HIGH THREAT OF NEW ENTRANTS
FIGURE 10.MODERATE THREAT OF SUBSTITUTION
FIGURE 11.MODERATE COMPETITIVE RIVALRY
FIGURE 12.CELL THERAPY MARKET: RESTRAINTS, DRIVERS, AND OPPORTUNITIES
FIGURE 13.GLOBAL BONE MARROW MARKET, 2019–2027 ($MILLION)
FIGURE 14.GLOBAL BLOOD MARKET, 2019–2027 ($MILLION)
FIGURE 15.GLOBAL UMBILICAL CORD-DERIVED MARKET, 2019–2027 ($MILLION)
FIGURE 16.GLOBAL ADIPOSE-DERIVED STEM CELL MARKET, 2019–2027 ($MILLION)
FIGURE 17.GLOBAL OTHERS(PLACENTA, AND NONSPECIFIC CELLS) MARKET, 2019–2027 ($MILLION)
FIGURE 18.COMPARATIVE ANALYSIS OF CELL THERAPY MARKET FOR AUTOLOGOUS, BY COUNTRY, 2019 & 2027 ($MILLION)
FIGURE 19.COMPARATIVE ANALYSIS OF CELL THERAPY MARKET FOR ALLOGENIC, BY COUNTRY, 2019 & 2027 ($MILLION)
FIGURE 20.COMPARATIVE ANALYSIS OF CELL THERAPY MARKET FOR MALIGNANCIES, BY COUNTRY, 2019 & 2027 ($MILLION)
FIGURE 21.COMPARATIVE ANALYSIS OF CELL THERAPY MARKET FOR MUSCULOSKELETAL DISORDERS, BY COUNTRY, 2019 & 2027 ($MILLION)
FIGURE 22.COMPARATIVE ANALYSIS OF CELL THERAPY MARKET FOR AUTOIMMUNE DISORDER, BY COUNTRY, 2019 & 2027 ($MILLION)
FIGURE 23.COMPARATIVE ANALYSIS OF CELL THERAPY MARKET FOR DERMATOLOGY, BY COUNTRY, 2019 & 2027 ($MILLION)
FIGURE 24.COMPARATIVE ANALYSIS OF CELL THERAPY MARKET FOR OTHER, BY COUNTRY, 2019 & 2027 ($MILLION)
FIGURE 25.COMPARATIVE ANALYSIS OF CELL THERAPY MARKET FOR HOSPITALS & CLINICS, BY COUNTRY, 2019 & 2027 ($MILLION)
FIGURE 26.COMPARATIVE ANALYSIS OF CELL THERAPY MARKET FOR ACADEMIC & RESEARCH INSTITUTES, BY COUNTRY, 2019 & 2027 ($MILLION)
FIGURE 27.U.S. MARKET SIZE AND FORECAST
FIGURE 28.CANADA MARKET SIZE AND FORECAST
FIGURE 29.MEXICO MARKET SIZE AND FORECAST
FIGURE 30.UK MARKET SIZE AND FORECAST
FIGURE 31.GERMANY MARKET SIZE AND FORECAST
FIGURE 32.FRANCE MARKET SIZE AND FORECAST
FIGURE 33.SPAIN MARKET SIZE AND FORECAST
FIGURE 34.ITALY MARKET SIZE AND FORECAST
FIGURE 35.REST OF EUROPE MARKET SIZE AND FORECAST
FIGURE 36.JAPAN MARKET SIZE AND FORECAST
FIGURE 37.INDIA MARKET SIZE AND FORECAST
FIGURE 38.CHINA MARKET SIZE AND FORECAST
FIGURE 39.AUSTRALIA MARKET SIZE AND FORECAST
FIGURE 40.REST OF ASIA-PACIFIC MARKET SIZE AND FORECAST
FIGURE 41.BRAZIL MARKET SIZE AND FORECAST
FIGURE 42.SAUDI ARABIA MARKET SIZE AND FORECAST
FIGURE 43.SOUTH AFRICA MARKET SIZE AND FORECAST
FIGURE 44.REST OF LAMEA MARKET SIZE AND FORECAST
FIGURE 45.JCR PHARMACEUTICALS: NET SALES, 2017–2019 ($MILLION)
FIGURE 46.MEDIPOST: NET SALES, 2017–2019 ($MILLION)
FIGURE 47.MESOBLAST: NET SALES, 2017–2019 ($MILLION)
FIGURE 48.NUVASIVE: NET SALES, 2017–2019 ($MILLION)
FIGURE 49.NUVASIVE: REVENUE SHARE, BY SEGMENT, 2019 (%
SELECT A FORMAT
Added to Cart
Electronic (PDF)

$5769

This license allows only one user to access the PDF.
Electronic (PDF)

$6450

This license allows 1 - 5 user to access the PDF, license is suitable for small groups of 5 users working together
Electronic (PDF)

$8995

This license allows users/teams in a same Enterprise to use this report, various departments within an enterpise can use this report
Electronic (PDF)

$3840

This license just provides quantitative data in a excel sheet
Add to Cart
Buy Now (15% Discount)

OUR CUSTOMER

SecuX Technology Inc

RELATED REPORTS

Global Clinical Data Management and Statistical Analysis Market Research Report 2024

120 Pages
Type: Report
Code: QYRE-Auto-38E10402
Sun Apr 07 00:00:00 UTC 2024

Add to Cart

Global Cancer Tumor Profiling Market Research Report 2024

120 Pages
Type: Report
Code: QYRE-Auto-6B2891
Tue Apr 02 00:00:00 UTC 2024

Add to Cart

Receptive Cell - Global Market Share and Ranking, Overall Sales and Demand Forecast 2024-2030

120 Pages
Type: Report
Code: QYRE-Auto-34N12630
Tue Mar 26 00:00:00 UTC 2024

Add to Cart

Adipose Tissue Derived Stem Cell - Global Market Share and Ranking, Overall Sales and Demand Forecast 2024-2030

120 Pages
Type: Report
Code: QYRE-Auto-8X13846
Tue Mar 26 00:00:00 UTC 2024

Add to Cart