Most Rent Burdened Zip Codes
By Amye Cutlip
Many Americans across the country can agree on one thing - rent is too darn high. In fact, millions of renters are considered cost-burdened or extremely cost-burdened. According to the Department of Housing and Urban Development, renters paying over 30% of their income on housing are cost-burdened, while renters paying over 50% of their income on housing are extremely cost-burdened. Economic, social, and political factors all contribute to one's cost burden status, some more so than others.
Here is the list of America's top 10 zip codes with the most severely cost-burdened renters:
Click for full-size graphic - 78705 - Austin, Texas
#1 - Zip code 78705
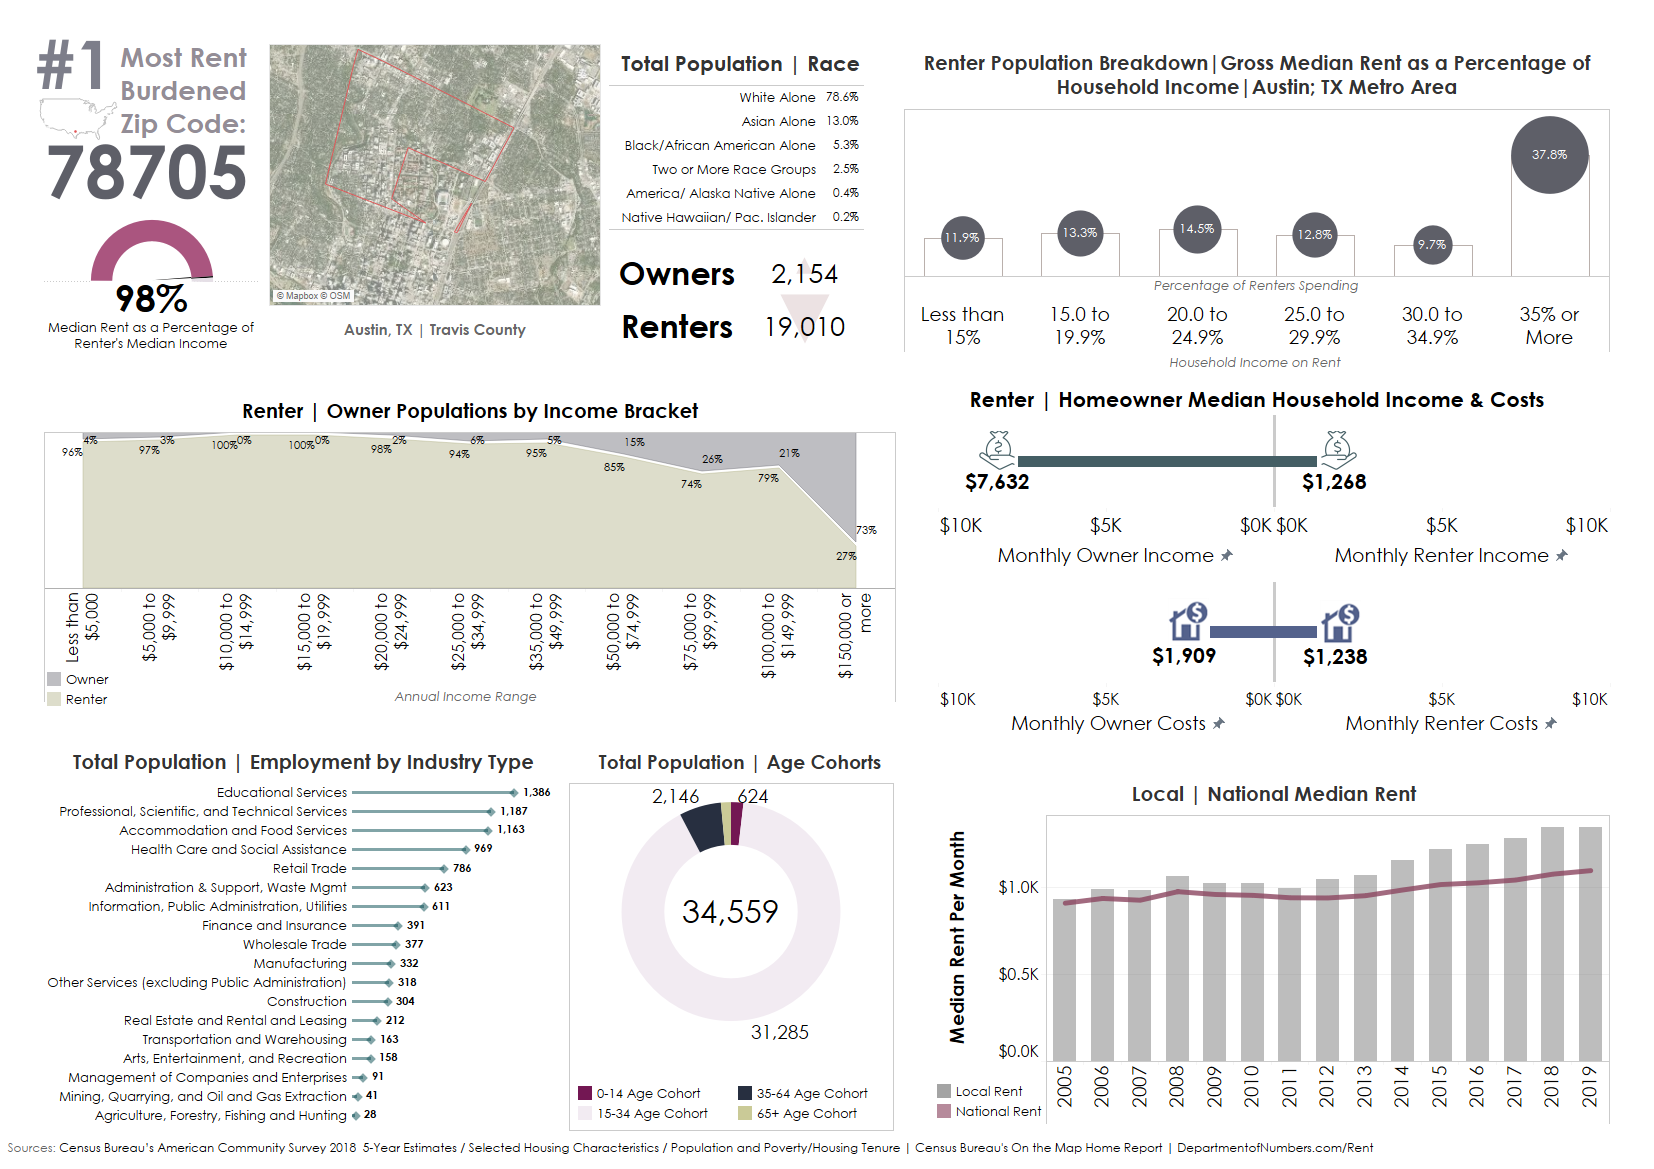
Austin's unique cultural identity as an artisanal hub for young professionals offers an array of citywide amenities; from its walkable neighborhoods and vibrant nightlife to world-famous festivals like South by Southwest, Austin continues to attract both visiting and long-term residents from all walks of life. Ranked as the number one place to live by US News & World Report, Austin meets nearly every metric determining a city's overall popularity. Originally put on the map as the Live Music Capital of the World, this Capitol City has also made a name for itself in the research and technology industries, spurring unprecedented economic and real estate development within the last decade.
Despite its eccentric roots, the city's abrupt economic growth has led to a subsequent cultural shift, leading to long-term natives advocating to "keep it weird." This slogan has become the axiom of "Old Austin," reminiscent of the city's quaint, bohemian vibe and organically curated neighborhoods, like the Old West Austin District. In fact, Austin was ranked as the second fastest-growing city by Forbes magazine in 2015. To accommodate the expanding population, local officials resorted to facilitating rapid real estate investment, which ultimately formed new concentrations of urban sprawl and gentrification. As a result, median rents increased from $1,036 in 2009 to $1,327 in 2019. During this time of enhanced urbanization, substantial investment within the entire metropolitan area has applied upward pressure in the renters' and owners' markets. This precipitous climb in real estate value leads directly to the displacement of smaller, local businesses and residents serving to create the city's original cultural landmarks and public spirit. But, in the case of zip code 78705, cost burdens threatening displacement might be largely affecting the more temporary residents of the city--college students.
Zip code 78705 is oriented around The University of Texas at Austin's Main Campus. Roughly 90% of the population are renting and 77% of residents are between the ages of 15 and 24 years old. Because of its proximity to the state's largest university of over fifty thousand enrollees, this zip code appears to be a popular location for student housing.
The median gross rent is $1,238 per month; roughly 98% of a renter's median income of $1,268 per month. Based on this rent to income ratio: 78705 is listed as the #1 most cost-burdened zip code for renters in the United States.
Click for full-size graphic - 07734 - Keansburg, New Jersey
#2 - Zip code 07734
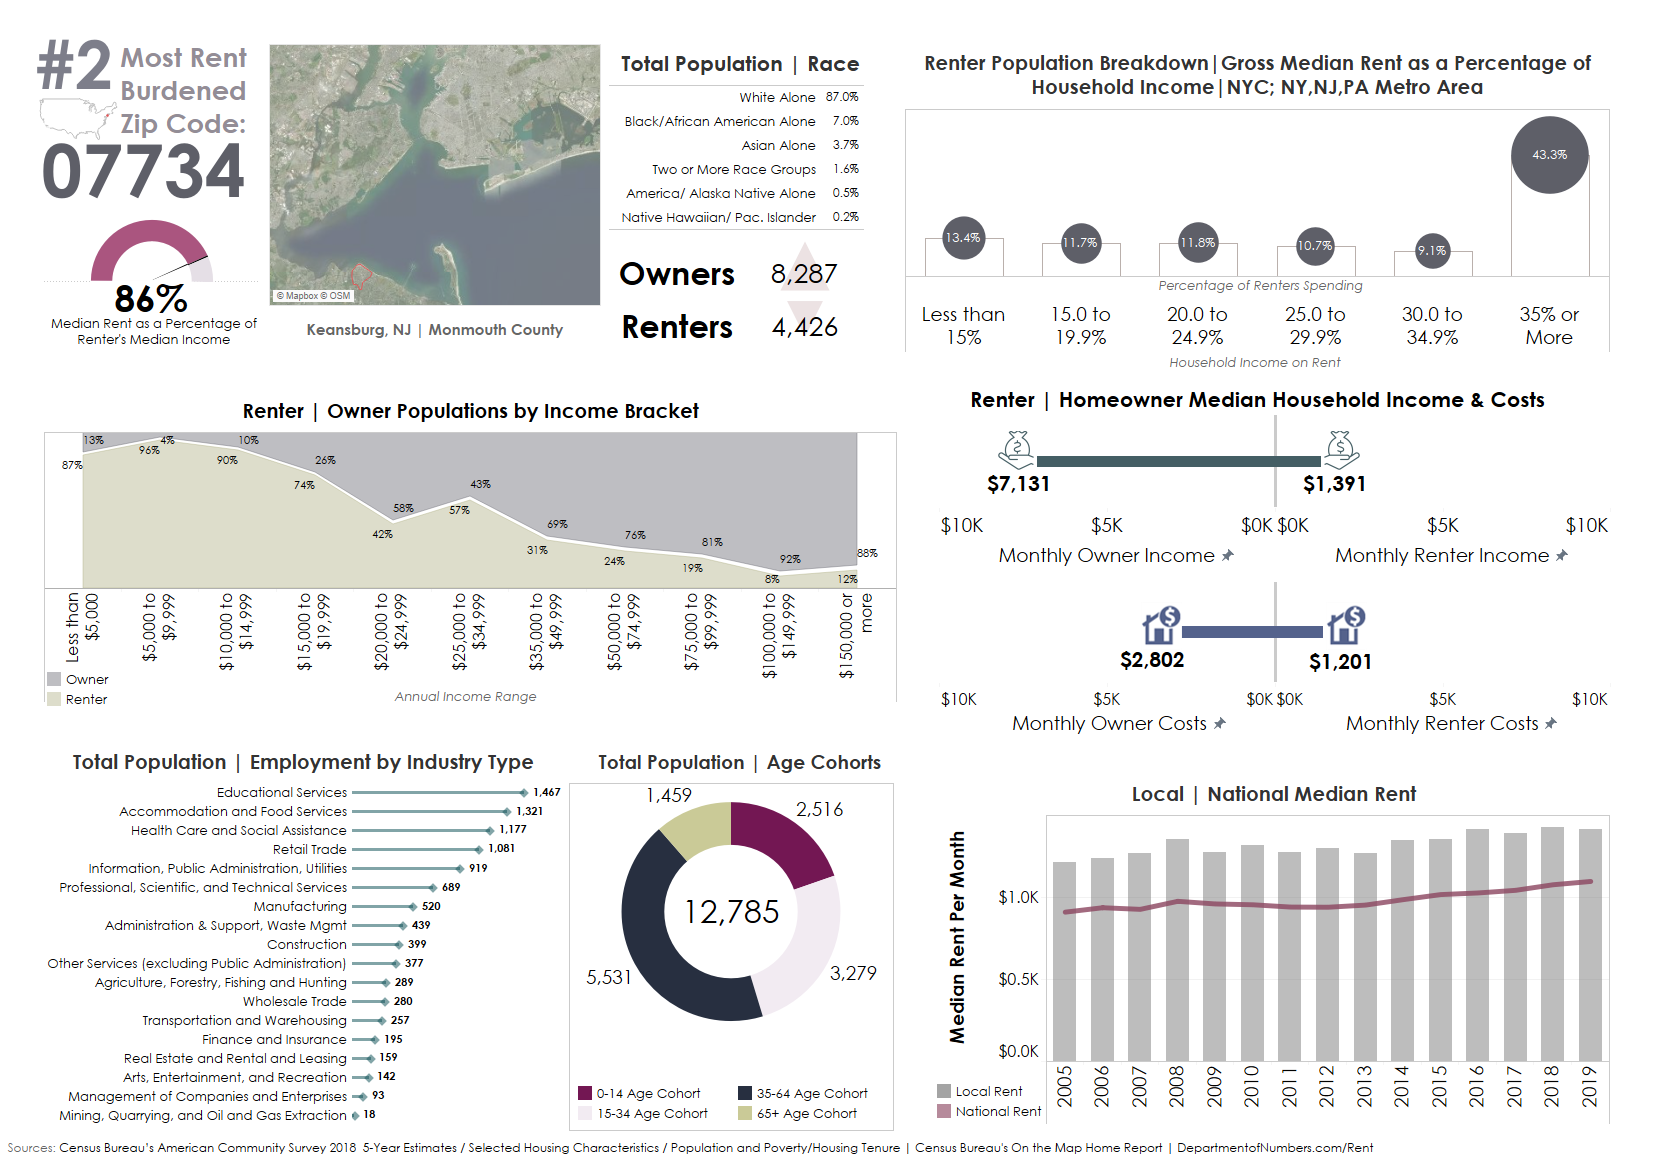
Situated within the Raritan and Sandy Hook Bays at the northern point of the Jersey Shore is Keansburg, a borough in Monmouth County, New Jersey, that's part of the greater New York City Metropolitan area. In the 1960s, Keansburg was a well-known weekend tourist destination for New York and New Jersey residents looking for a weekend getaway from the city.
Since Keansburg's founding, it has been a major tourist attraction due to its beaches, wildlife, and recreational activities. The borough's major landmark is the Keansburg Amusement Park, known as 'the boardwalk,' by locals, and is often credited for establishing Keansburg's economic base. A local steamboat company facilitated round trips from New York City to the Jersey port up until Hurricane Donna struck in 1962, destroying a large portion of Keansburg's Waterfront Areas.
Around this same period, Keansburg began its transition from a resort destination to a residential town. By 1969, the borough invested nearly 8 million dollars to redevelop its boardwalk area, which included conservation efforts to protect its beaches from future damages caused by tropical storms and hurricanes. But a series of fires in the 1980s destroyed several structures on the north side of the boardwalk, causing an estimated $1.4 million in property damage.
Through various iterations of restoration and preservation, residents have managed to keep this local staple true to form, as it continues to be a major seasonal attraction from April through October. While Keansburg Amusement Park remains the hallmark of this borough, it's also one of the only economic drivers in the area. For zip code 07734, these financial conditions contribute to the cost burden of locally employed residents in an upward trending rental market due to its proximity to New York City.
Zip code 07734 encapsulates the entire residential area and all tourist destinations in Keansburg. Overall household economic mobility for boardwalk employees living within this boundary is likely to be strained during non-seasonal months, causing a major divide in household income between locally employed, lower-wage renters and regionally employed, higher-wage owners. According to the Census Bureau, the median household income for homeowners is $85,572. However, renter household income is $16,692.
The median gross rent is $1,201 per month; roughly 86.3% of a renter's median income of $1,391 per month. Based on this rent to income ratio: 07734 is listed as the #2 most cost-burdened zip code for renters in the United States.
Click for full-size graphic - 60464 - Palos Park, Illinois
#3 - Zipcode 60464
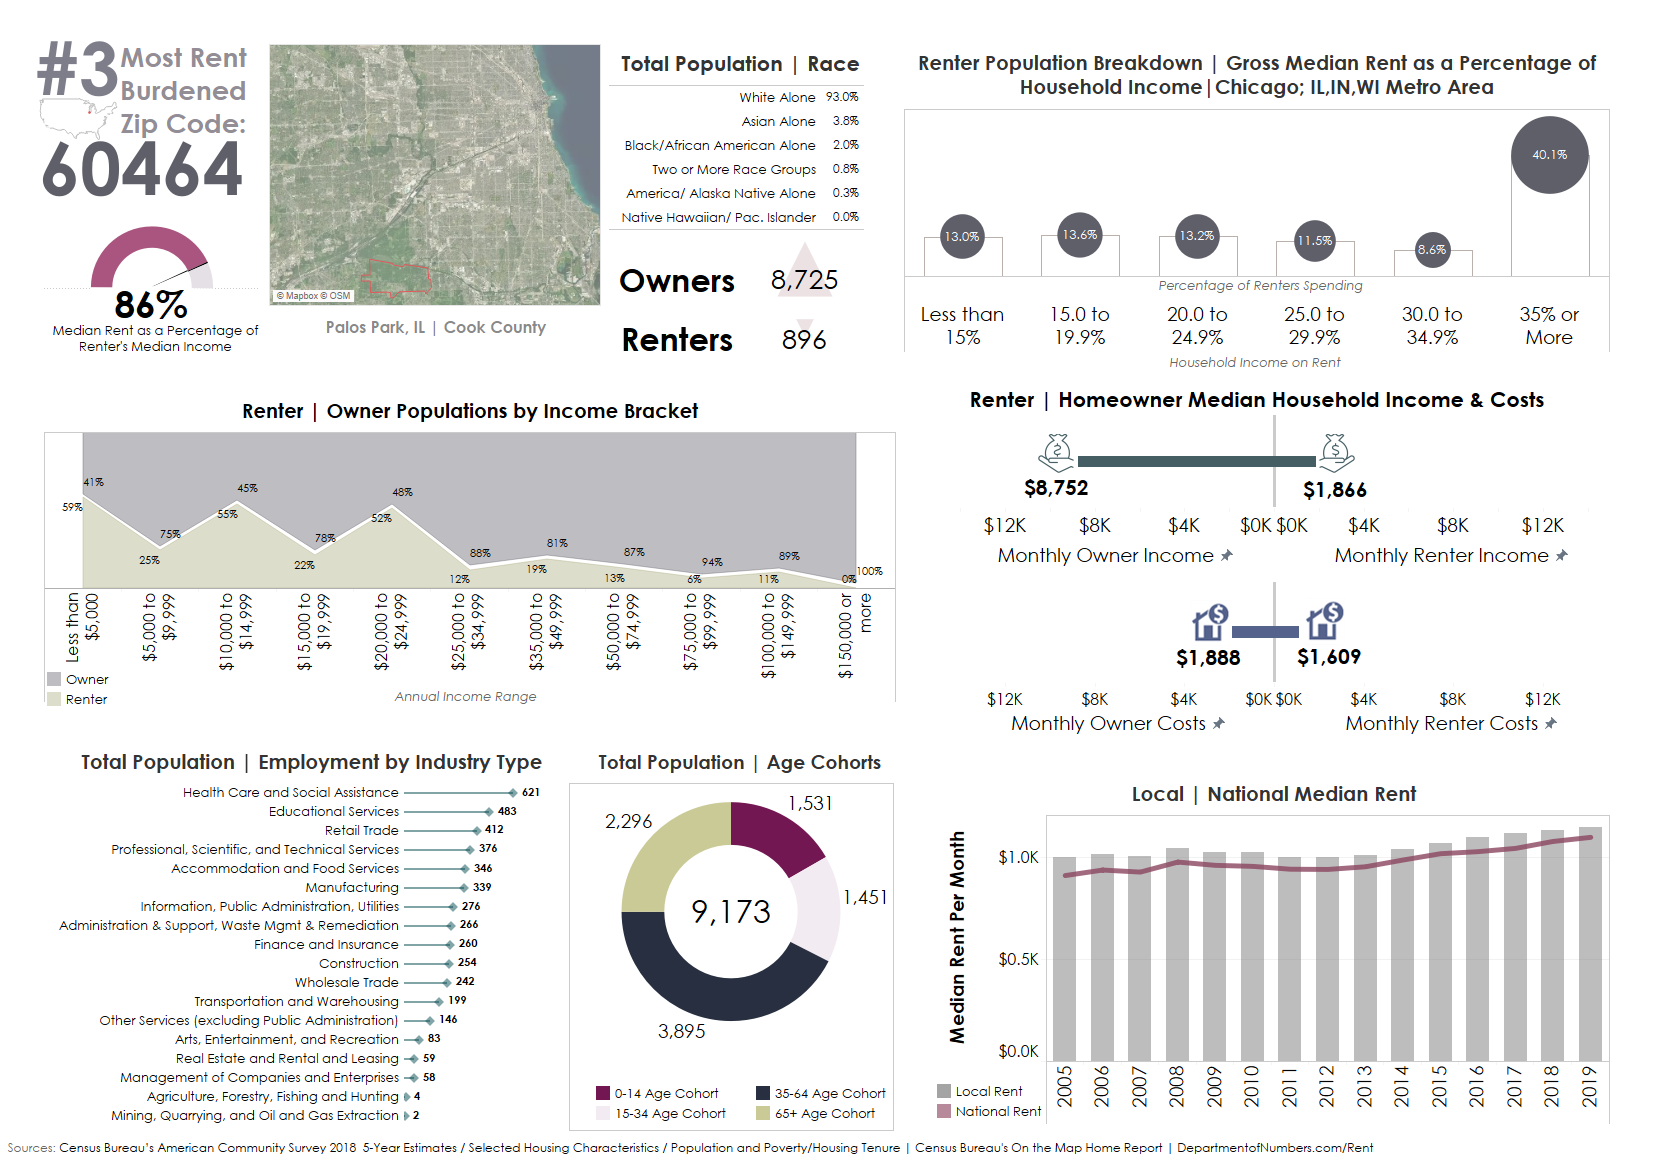
Located 25 miles outside of Chicago, Palos Park has become one of most high-end suburban areas within the metropolitan area, accommodating prosperous residents with a variety of spacious, single-family dwellings on large parcels of land. Prior to suburban expansion, Palos Park was a notable weekend and seasonal destination for Chicagoans before developing into a residential community. Preservation efforts to maintain the natural beauty of Palos Park have protected nearly 11,000 acres by the Cook County Forest Preserve. This unique topography is widely regarded as a community asset by residents, but it has also limited the village's propensity for additional development. In an effort to address the community's stagnant economic and residential growth, local officials began to facilitate plans for commercial and residential expansion beyond its extensive inventory of annexed high-end properties in February of 2020.
According to planning records, the plurality of residents who participated in this public decision-making process petitioned to uphold the village's existing character as a high-end suburban enclave; only supporting plans to increase the neighborhood's stock of one-acre single-family dwellings. The NIMBYism illustrated from these public meetings could very well hinder plans for community expansion. The political will of local officials tends to skew in favor of their more affluent constituents, as they are more likely to use their voting power and financial campaign support as political leverage. While a smaller group of individuals have expressed an interest to diversify the village's housing stock, especially for their aging population, this support is, unfortunately, no match for the 88% of homeowners who stand in direct opposition to community evolvement, even if this decision is at the expense of their senior residents.
In zip code 60464, 61% of the population living below the poverty line were aged 65 years or older, an issue facing a growing number of renting seniors across the country. Elderly populations tend to live off a set income from retirement and social security, keeping senior renters at a much higher risk of experiencing cost burdens and even displacement from their communities once the price of living supersedes their financial reserves.
According to the Census Bureau, the median household income for homeowners in zip code 60464 is $105,026. Renter's household income is $22,386; well below the national median, while the median rent is 52% higher than the national median. These inflated costs are undoubtedly reflective of the village's upscaled value from their single-family estates, a common residual effect of the real estate valuation system.
The median gross rent is $1,610 per month; roughly 86.2% of a renter's median income of $1,866 per month. Based on this rent-to-income ratio: 60464 is listed as the #3 most cost-burdened zip code for renters in the United States.
Click for full-size graphic - 93405 - San Luis Obispo, California
#4 - Zip code 93405
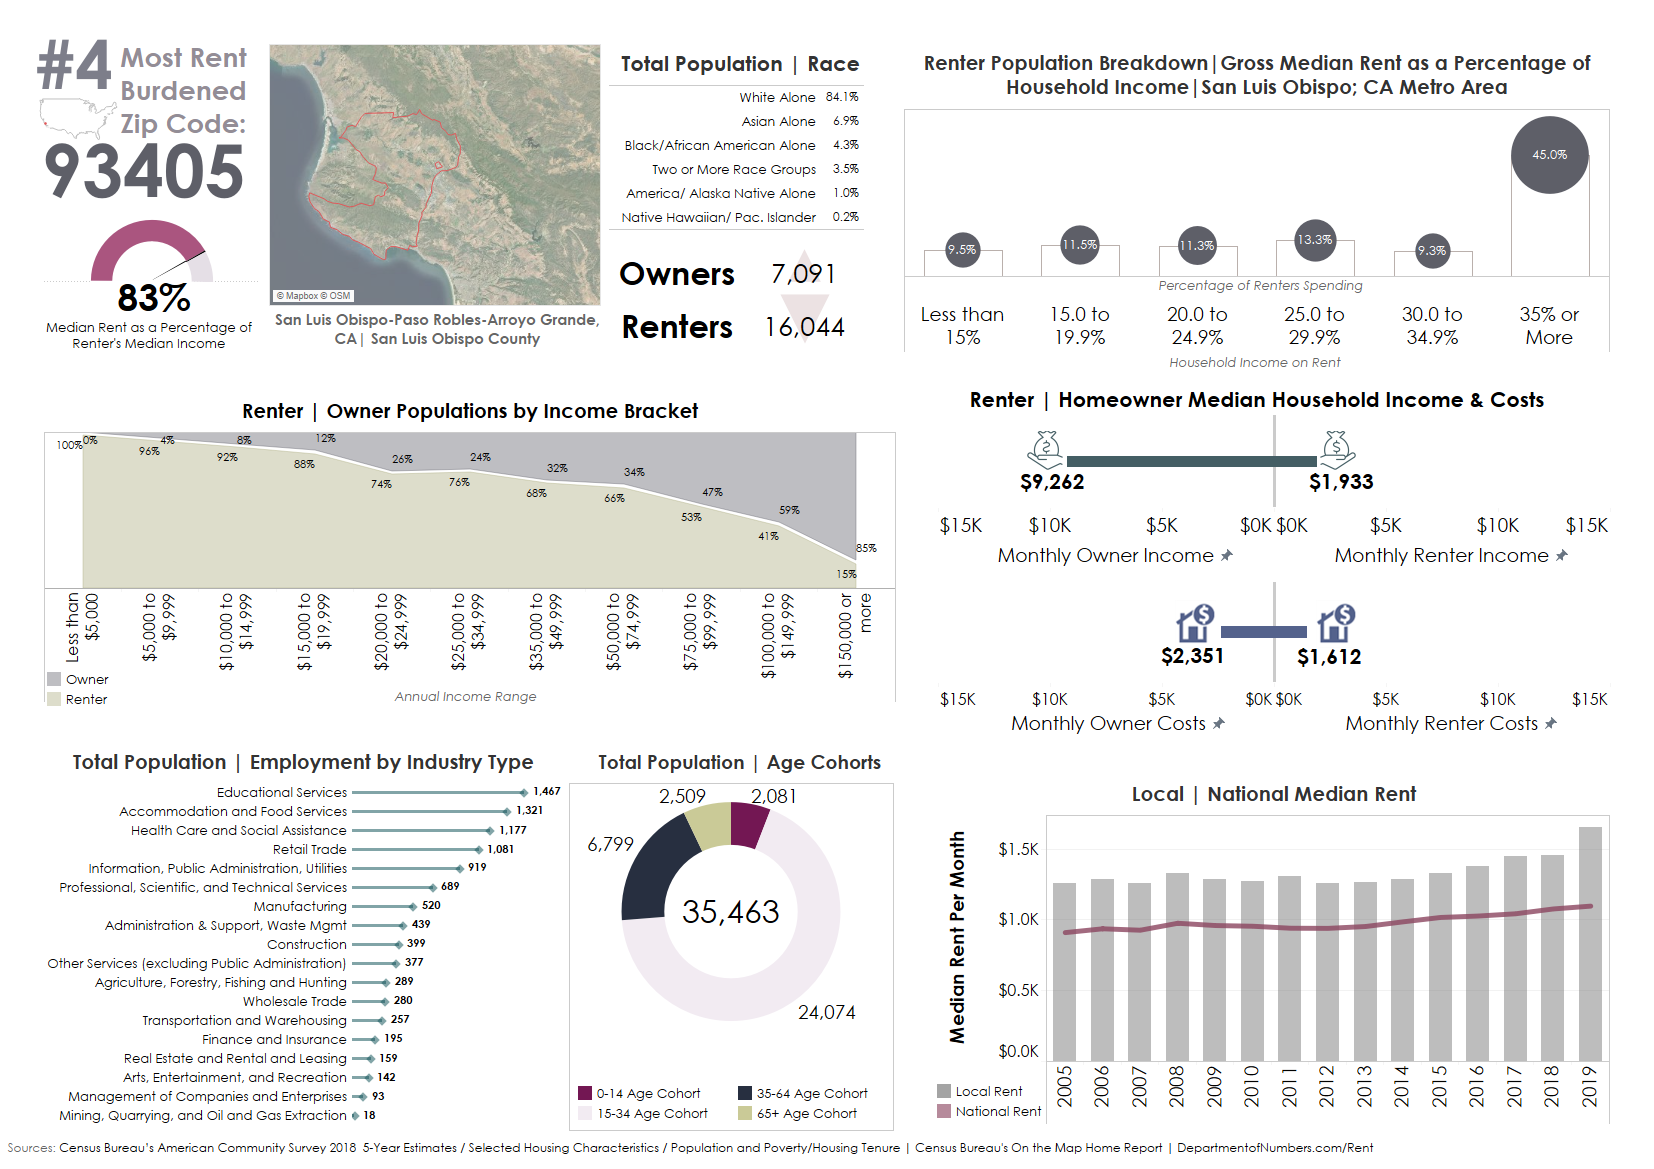
San Luis Obispo-Paso Robles-Arroyo Grande is one of 21 Spanish missionary' outposts established between 1769 and 1833, whose objective was to evangelize the indigenous people of California. Downtown San Luis Obispo is centered around the town's founding church, Mission San Luis Obispo de Tolosa. This cultural landmark, along with other various historic districts in the town, is registered under local and state preservation programs, meaning that these sites prohibit any renovation or redevelopment efforts that could alter their historic integrity.
Apart from defending the legacy of 18th-century missionary annexation, San Luis is also known for its agricultural output as the third largest wine producer in California. California Polytechnic State University also has established its roots as the largest employer in the area. With a prime location roughly halfway between Los Angeles and San Francisco, this old money town along the pacific coast has also become a prominent tourist destination for outdoor thrill seekers and wine moms alike.
Except for a few plots of developed land, including the California Polytechnic State University campus, zip code 93405 is mostly covered in large swaths of forested areas on the southern perimeter, with agricultural areas nestled between canyons and ridges on its northern perimeter. Over half of 93405's population is between the ages of 15-24, likely to be CPSU students renting from non-campus housing, or residents in the tourism industry, whose income categorically falls well below the national median. By virtue of its location in the state of California, notorious for its outrageous real estate costs, this region has experienced its own unique housing affordability epidemic further exacerbated by limited employment opportunities within a stagnated real estate market.
The median gross rent is $1,612 per month; roughly 83% of a renter's median income of $1,933 per month. Based on this rent-to-income ratio: 93405 is listed as the #4 most cost-burdened zip code for renters in the United States.
Click for full-size graphic - 20607 - Accokeek, Maryland
#5 - Zip code 20607
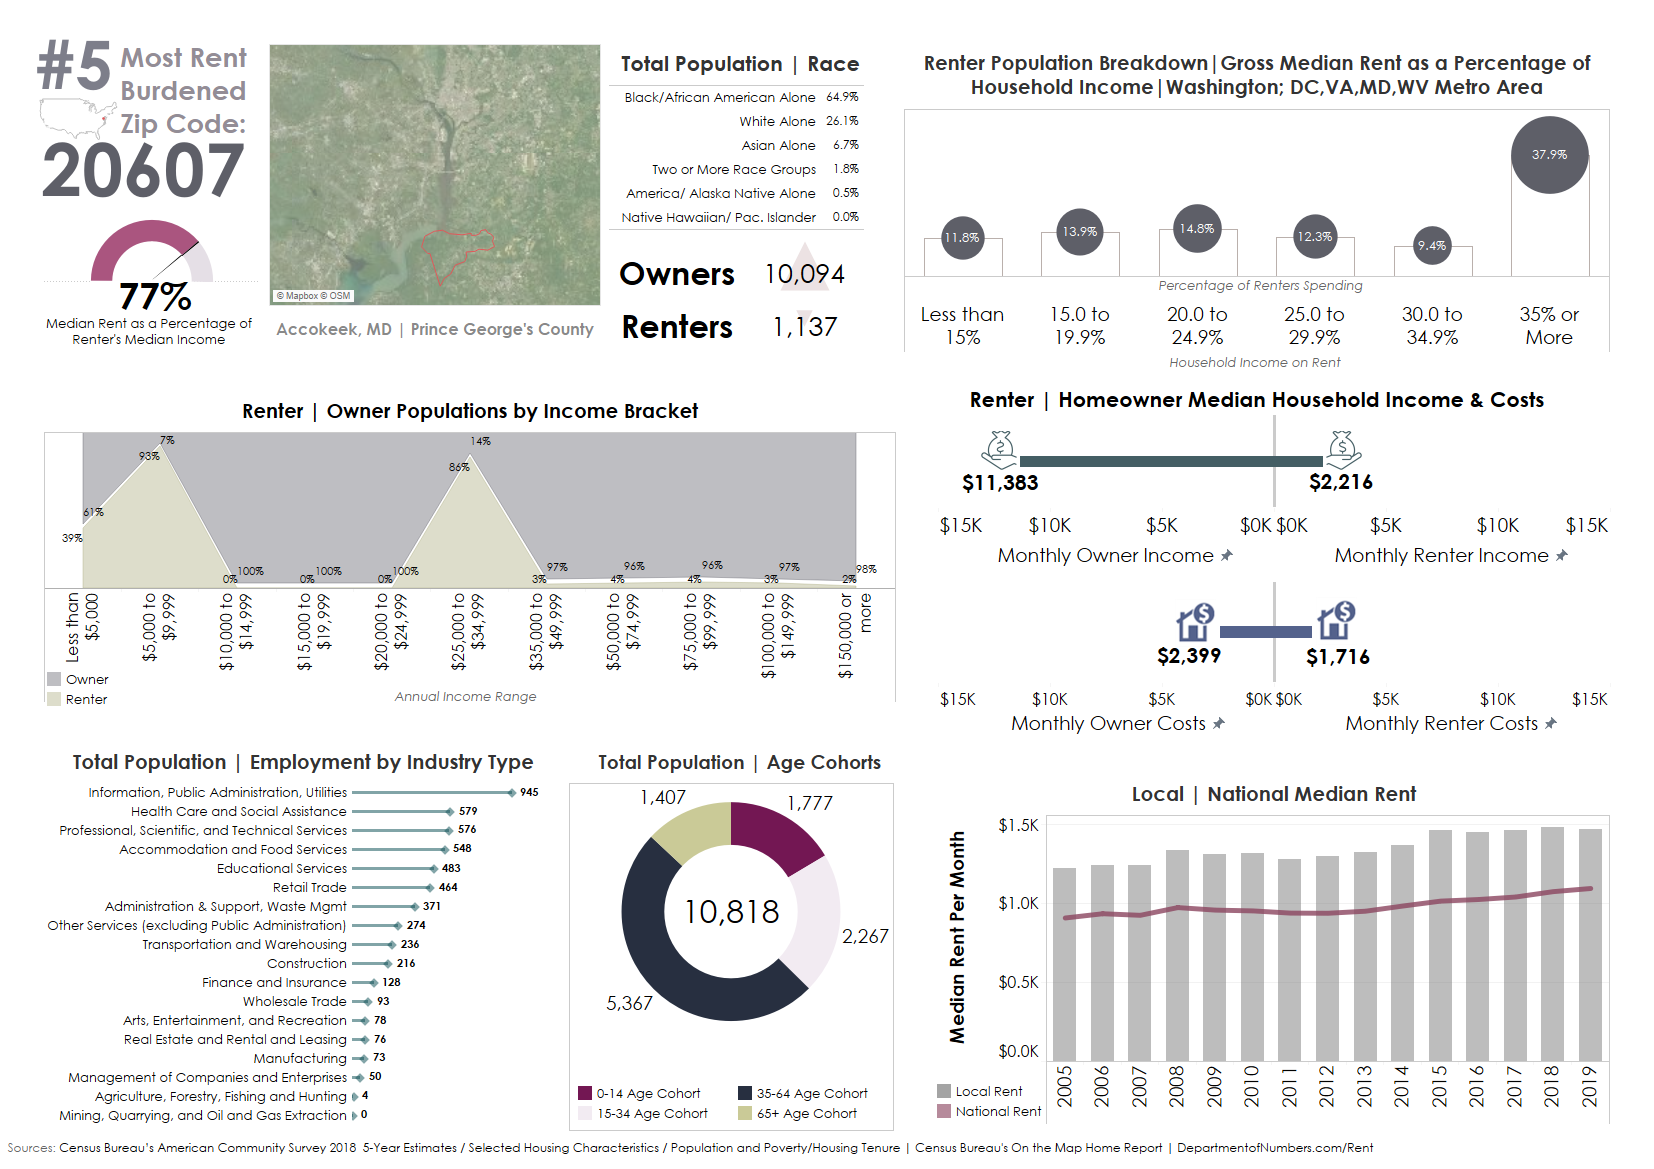
Accokeek is an unincorporated town on the Potomac River of Prince George County Maryland, 17 miles outside of Washington, DC. The town's name, which means "at the edge of the hill" derives from the Algonquian-language tribe residing in the area prior to English colonization. Because of Accokeek's status as an unincorporated area, it is not governed by a local municipal corporation. Unincorporated districts tend to evidence low populations due to general desolation, commonly found in rural areas. Municipalities may also be dissolved as a result of a diminished tax base following economic dispossession, transferring local service responsibilities to a higher administration. The latter most certainly does not apply to Accokeek, as the median household income is over $130,000 per year; nearly double the national median. In lieu of a municipal planning department, the Accokeek Development Review District Commission reviews all applications for subdivisions within the Accokeek Road Corridor to determine land-use decisions.
With little to no administrative barriers or regulatory oversight, this designated community of high-priced homes in the DMV has seemingly transcended into a large Homeowners Association, with 95% of owners and 5% of renters occupying the area. The town's physical form of planned suburban neighborhoods began rapidly expanding in the early 2000s. Recent residential development includes only a marginal number of 2+ bedroom apartments and rowhomes for 40% of renters living in this area. The remaining 60% are occupying single-family rentals in 4 or 5+ bedroom homes.
Like in most communities taken over by real estate interests, this development comes at a heavy price for residents whose occupancy predates community transformation. Legacy residents are often slowly priced out of their own communities because their economic and material conditions are incompatible with the households in which rapid, manufactured suburbanization aims to serve. As Accokeek home prices continue to top the list of most expansive homes in America, the cost burden for long time renters also continues to soar, leaving little to no recourse for these at-risk households in the unincorporated zip code of 20607.
Median gross rent is $1,716 per month; roughly 77.5% of a renter's median income of $2,216 per month. Based on this rent-to-income ratio: 20607 is listed as the #5 most cost-burdened zip code for renters in the United States.
Click for full-size graphic - 79401 - Lubbock, Texas
#6 - Zip code 79401
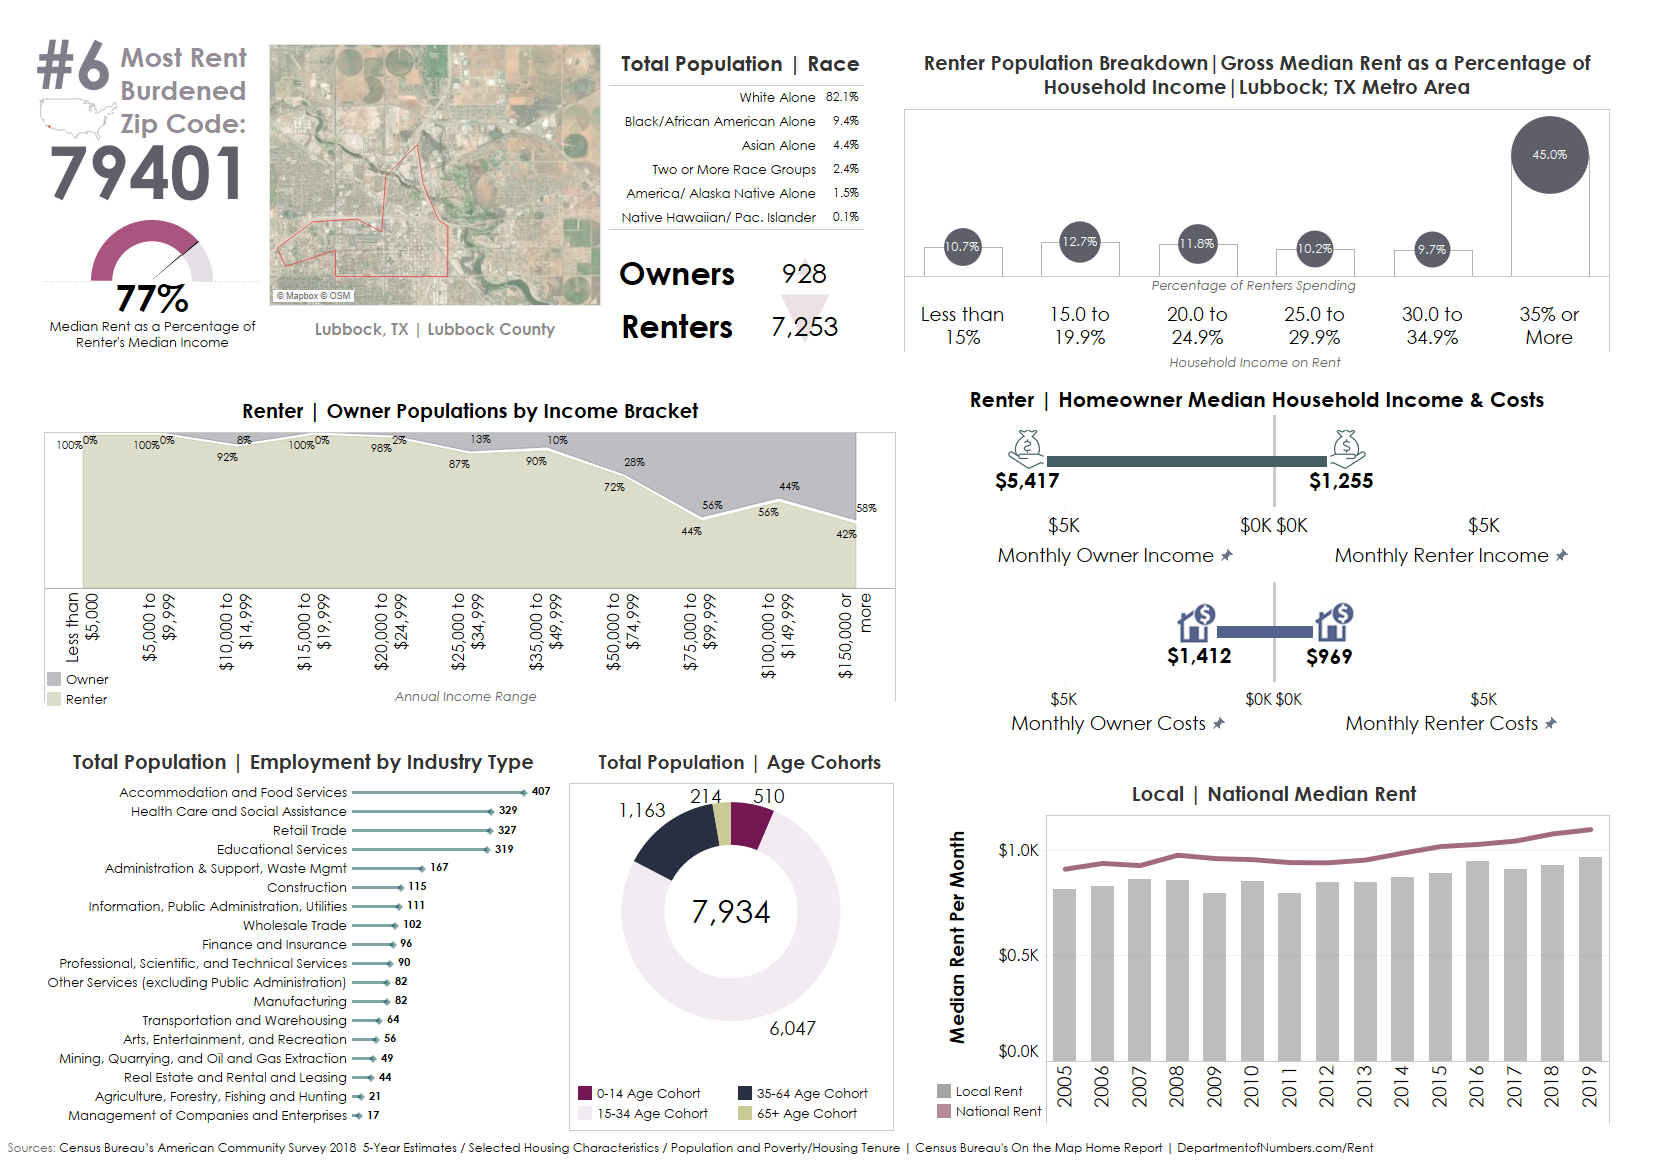
Lubbock Texas has preserved its identity around its most prized economic and cultural origins of local artistry and agricultural output. Known as the Hub City, Lubbock is also the home of Texas Tech University; one of the largest employers in the area. Spatial preservation of art and cultural districts in the downtown Lubbock area has created a unique space that attracts hundreds of thousands of weekend tourists each year while promoting economic and social mobility for its residents.
While Lubbock has maintained its cultural identity as the home of world-class artists and musicians, through the creation of specialized districts in the downtown area, it has also strived to further diversify and urbanize its downtown area with sought after amenities, including pedestrian-oriented development centered around commercial districts, restaurants, breweries, and wineries that tend to evidence a thriving communal core. These placed-based development projects are common tools for increasing investment and overall revitalization of an area.
In 1997, Lubbock formed the Economic Development Alliance to expand its industrial horizons. The city's objective was to recruit new businesses into their commercial district, create better-paying jobs, and ultimately improve the quality of life for Lubbock residents
However, creating a long-range economic plan that brings in a new cohort of residents and businesses can also negatively impact lower-wage individuals and families when economic expansion accelerates local costs of living. Roughly 21% of the population lives below the poverty line. Of that population, 11% are families, including 24.5% of those under age 18.
The western boundary of zip code 79401 is directly adjacent to Texas Tech's main campus and includes the downtown commercial district as well as the city's most visited tourist destinations. This mix of student renters and low-wage employees could be reflected in 79401's median household income of $18,798 per year.
The median gross rent is $969 per month; roughly 77.2% of a renter's median income of $1,255 per month. Based on this rent-to-income ratio: 79401 is listed as the #6 most cost-burdened zip code for renters in the United States.
Click for full-size graphic - 06268 - Storrs, Connecticut
#7 - Zip code 06268
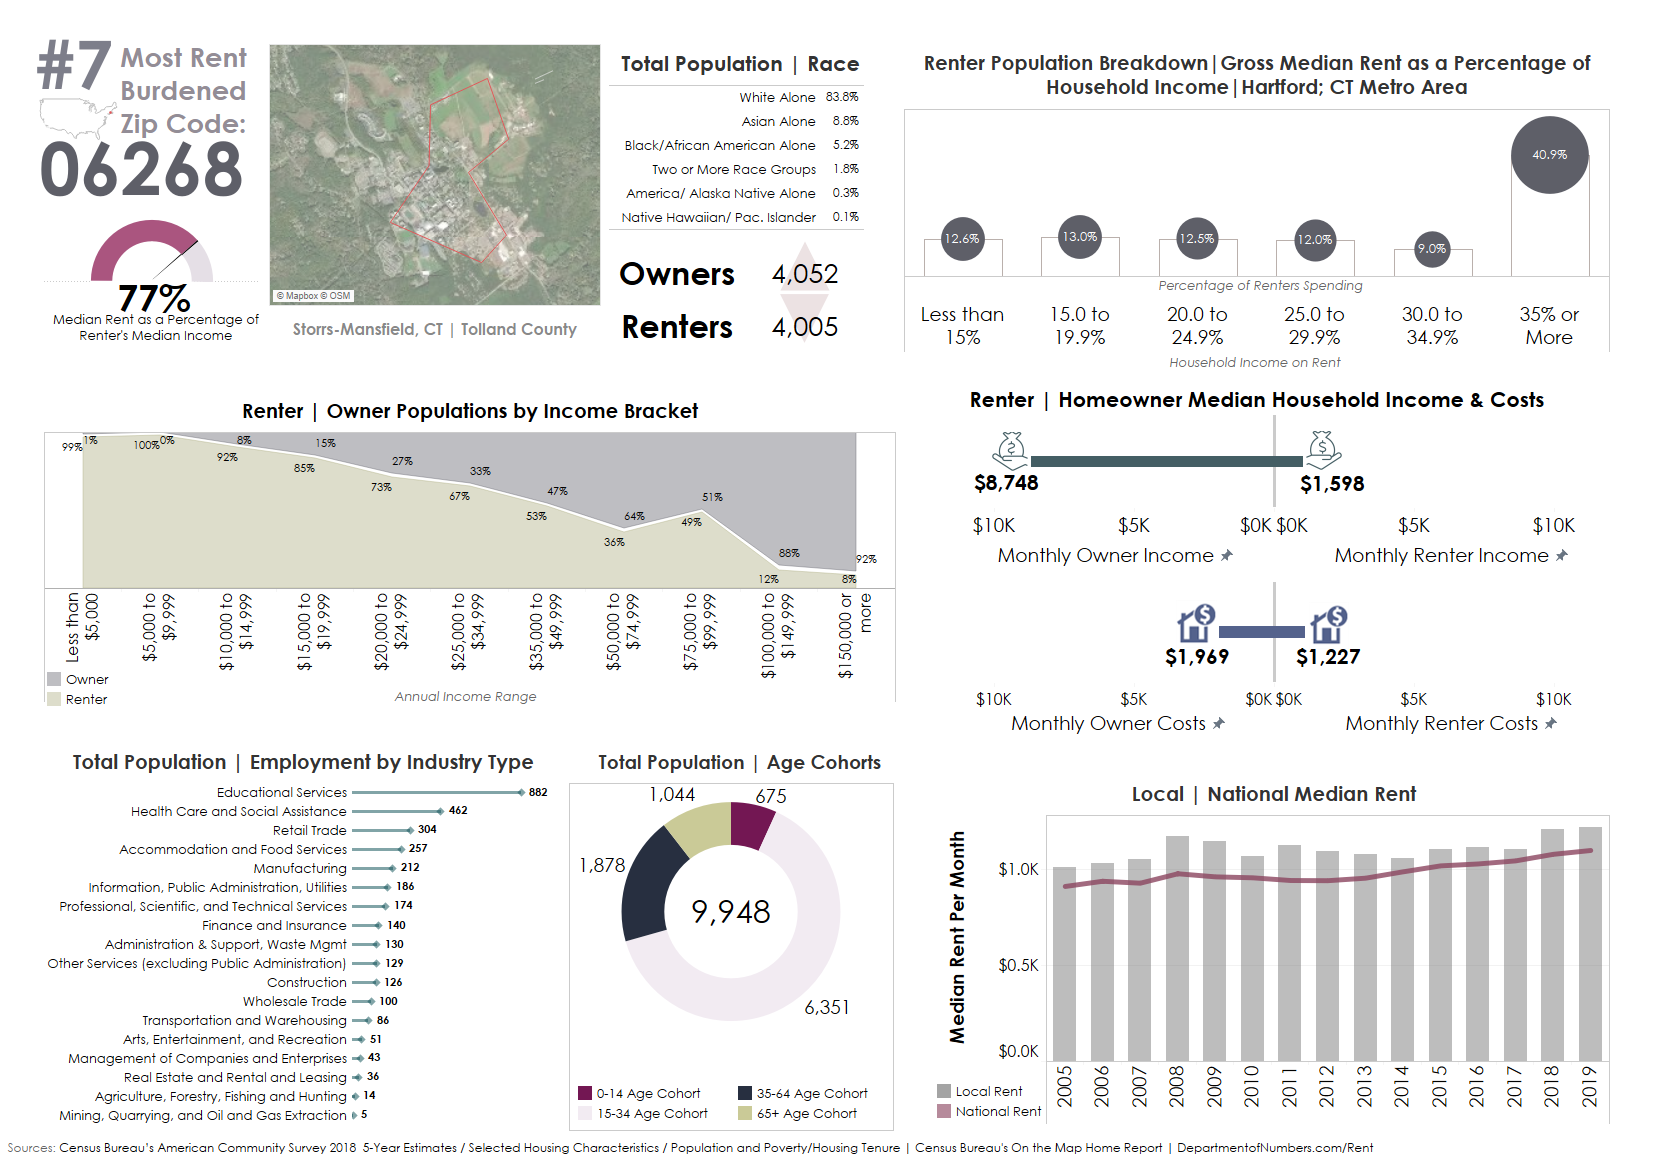
Storrs is a census-designated place located within the town of Mansfield, CT, home of the University of Connecticut and its affiliated Connecticut Repertory Theater. A true 'college town', Mansfield's economy and built environment are designed almost exclusively around this University. Downtown Storrs, which is adjacent to UConn's campus, is known for its vibrant walkable downtown area for university students to enjoy a variety of restaurants, shops, entertainment, and nightlife.
While the downtown Storrs area notably caters to its university population, these designated amenities likely double as a secondary economic hub for UConn students. According to the Census Bureau, the plurality of the jobs in zip code 62680 are within the Accommodation and Food Service division of the Tourism Industry, the lowest-paid labor sector in the U.S. economy. In 2019, 43% of the population had an income below the poverty level, a significant deviation from the national poverty rate of 11.4%. This high concentration of minimum wage, part-time work in downtown Storrs plausibly correlates to a high rate of college kids working and living off-campus.
The University of Connecticut's undergraduate enrollment has increased by 63% since 1995, hitting a total enrollment of over 32,000 students in 2017. This gradual increase in student attendees led to a radical shift in the surrounding built environment, as private developers and contractors leaped to accommodate the area's growing local population. The municipal government eventually intervened by imposing a temporary moratorium on new subdivisions and land acquisitions, staying true to its overarching goal to protect the surrounding area's natural environment and open space. By actively pursuing what are called "smart growth" strategies, local officials control the area's environment by exclusively designating new construction only in existing downtown areas.
Capping physical and economic development despite a growing populous may lead to job and housing scarcity, synthetically increasing the value of current and future real estate. As the cost of land and property acquisitions rise, so does the cost of occupying these spaces. This could explain why the rent in zip code 06268 is more expensive than most small, college-oriented towns.
The median gross rent is $1,227 per month; roughly 77% of a renter's median income of $1,598 per month. Based on this rent-to-income ratio: 06268 is listed as the #7 most cost-burdened zip code for renters in the United States.
Click for full-size graphic - 86011 - Flagstaff, Arizona
#8 - Zip code 86011
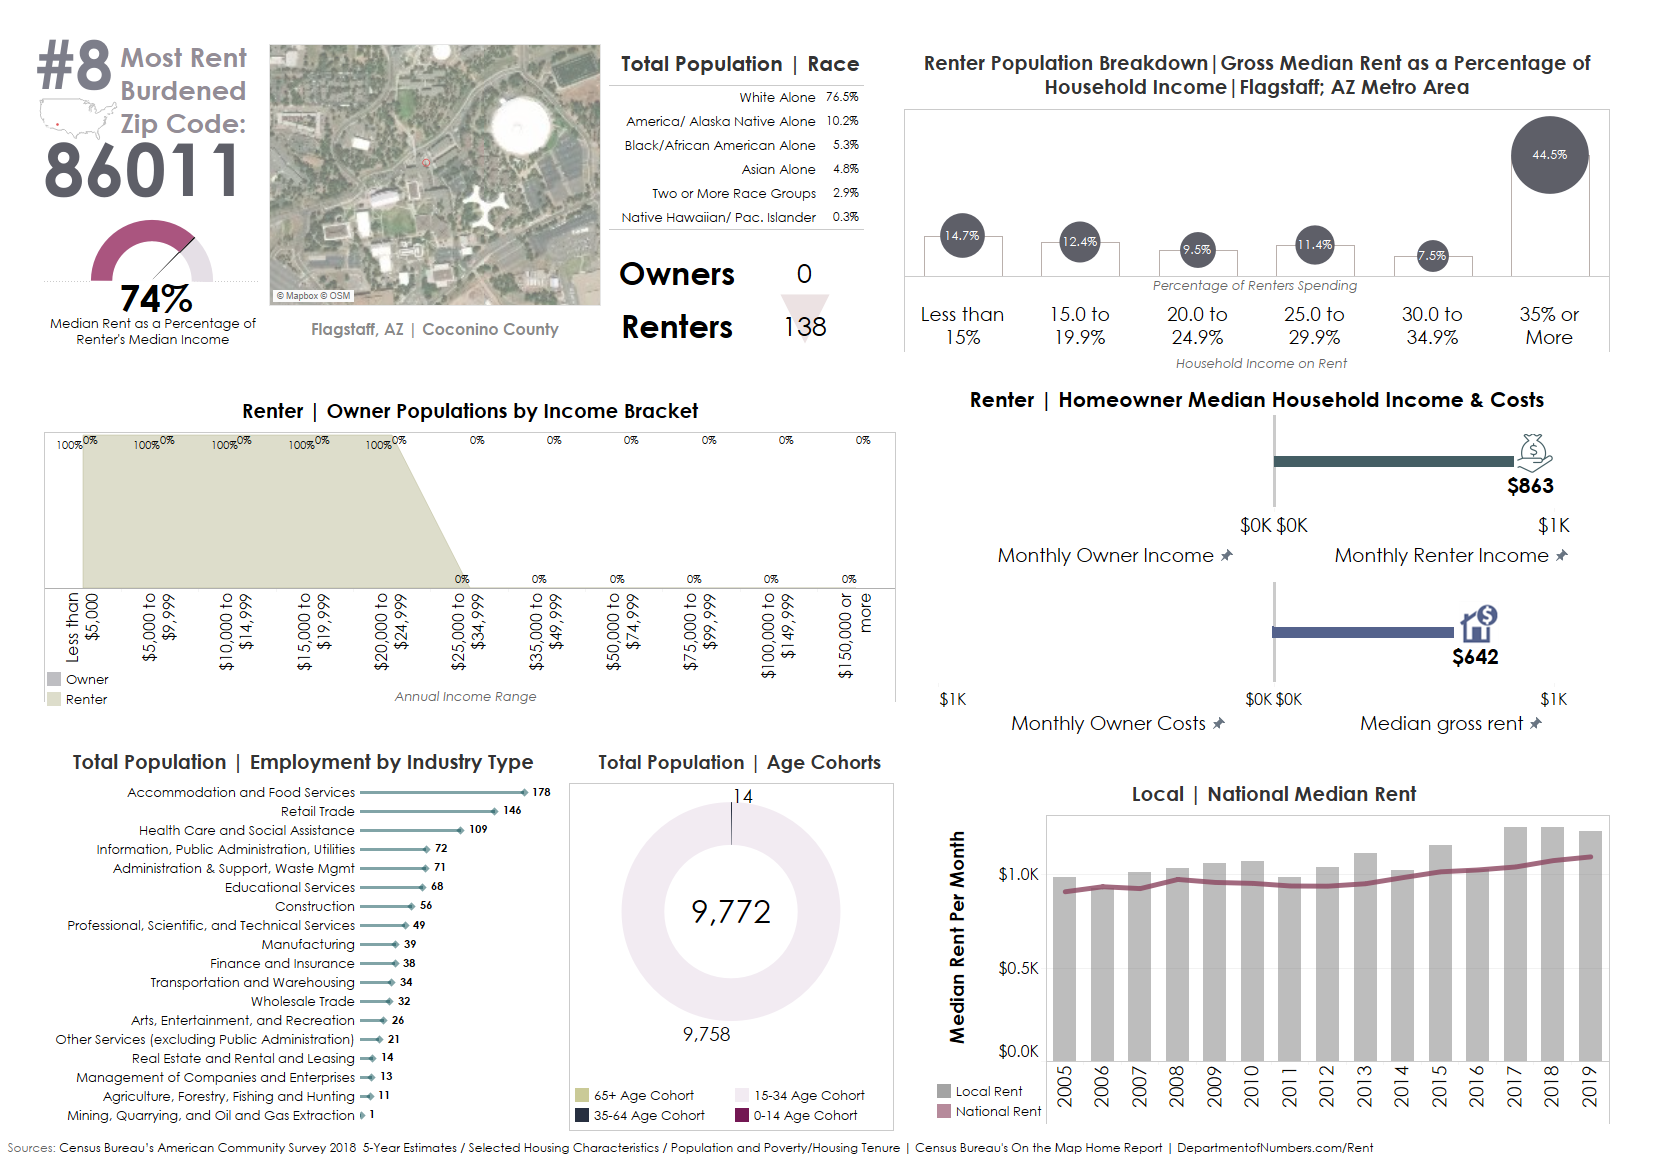
Located off Interstate 40, a common route for travelers heading to the Grand Canyon is Flagstaff, Arizona. But Flagstaff isn't just on the way to one of the most popular wonders of the world. Today, it's become a popular destination for tourists, while developing economic bases in the education, government, and transportation sectors of the economy. Flagstaff is also home to Northern Arizona University, widely acclaimed for its research and development in science and technology. These landmark facilities and instruments, including the Lowell Observatory, double as tourism nodes for skywatchers and geology enthusiasts.
In 2001 the International Dark-Sky Association designated Flagstaff as the world's first International Dark-Sky City, based on the community's long-lasting efforts to preserve dark skies through policies and best practices. As more students are driven to this unique research-based campus, NAU administrators have struggled to accommodate for growth while remaining in compliance with local lighting ordinances.
Residents have routinely protested large, off-campus student housing projects near the Northern Arizona campus, for fear that a student presence will drive down existing home values, obstruct views, and increase traffic congestion in surrounding residential areas. Advocating for the exclusionary nature of suburban neighborhoods through political outrage and public spectacle is known as NIMBYism, derived from the colloquialism "Not In My Back Yard." After a series of deliberations, The University eventually allocated land within its campus boundary for more on-site housing opportunities. But instead of investing in university-owned housing, NAU brokered a deal with private real estate companies to build luxury student housing at market rate prices.
Zip code 86011 is Northern Arizona University's main campus and includes the following upscale properties: The Suites, Hilltop Townhomes, Sky View, and the Jack. While these student housing options are physically on campus, the complexes are owned by American Campus Communities, the largest developer of student housing communities in the United States. College students exclusively make up this group of renters, evidencing the real cost burden that off-campus students are experiencing when paying market-based rent.
The median gross rent is $642 per month; roughly 74% of a renter's median income of $863 per month. Based on this rent-to-income ratio: 86011 is listed as the #8 most cost-burdened zip code for renters in the United States.
Click for full-size graphic - 92617 - Irvine, California
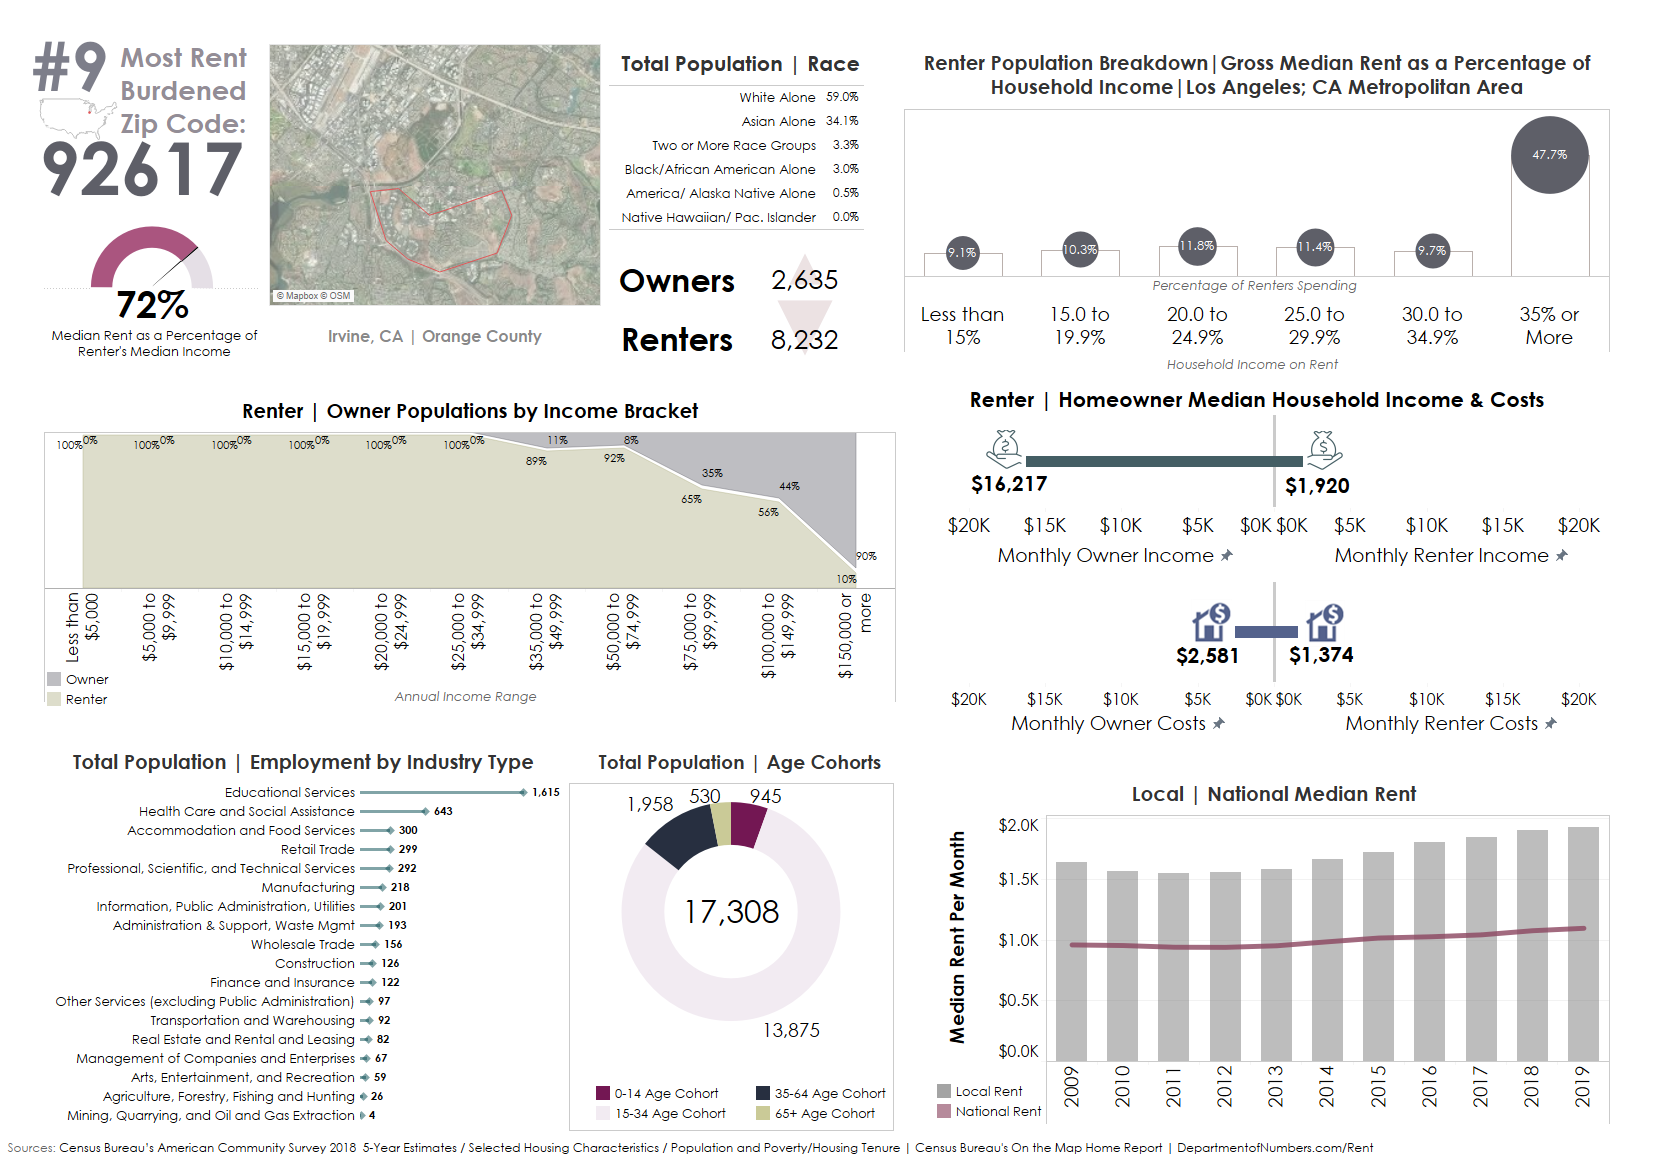
#9 - Zip code 92617
Irvine, California is a suburbanized, master-planned city in the Los Angeles metropolitan area, known for hosting affluent professionals in the region. Irvine's commercial district has attracted partnerships from a range of businesses in leading industries, making Orange County one of the fastest-growing job markets in the last two decades. With over 200,000 jobs in a city of 260,000 residents, this master-planned community has become one of the most successful, safest, and expensive areas in the country.
The city's name and that of its university stem from the Irvine Family, a prominent unit of real estate developers in Orange County. During the early 1960s, the university and company, together with architect William Pereira, designed the Irvine Ranch Master Plan. The city of Irvine, whose citizens officially incorporated it in 1971, grew around the campus. Irvine was originally envisioned to be nominally divided into townships that were separated by six-lane streets. Each township would contain a series of uniformly designed homes, with commercial centers, religious institutions, and schools' checker-boarded in the periphery of its residential areas.
The city's final design took the form of a necklace, with the villages threaded along two parallel main streets, ending where the boundary of UC Irvine begins. The UCI circular formation creates the pendant portion of the necklace. The unique master design of the campus pays homage to the city's original plan envisioned by William Pereira. Its conceptual blueprint included large open spaces, embellished with decentralized suburban facilities rather than the standard campus design built within a dense urban format. Undergraduate scholars are concentrated in the central campus, while graduate and professional schools are located closer to the campus' outer perimeter.
Zip code 92617 includes a large portion of UCI's campus and adjoined residential spaces. Although the campus originally promoted an equitable layout for undergraduates, this concept has lost some of its meaning today, with 85% of UCI students living off-campus altogether. Without an adequate supply of campus housing, students who are anchored to their university but don't live in college-owned, operated, or affiliated lodging end up paying a substantial premium in the private market, obliged to live well beyond their means.
The median gross rent is $1,374 per month; roughly 71% of a renter's median income of $1,920 per month. Based on this rent-to-income ratio: 92617 is listed as the #9 most cost-burdened zip code for renters in the United States.
Click for full-size graphic - 15213 - Pittsburgh, Pennsylvania
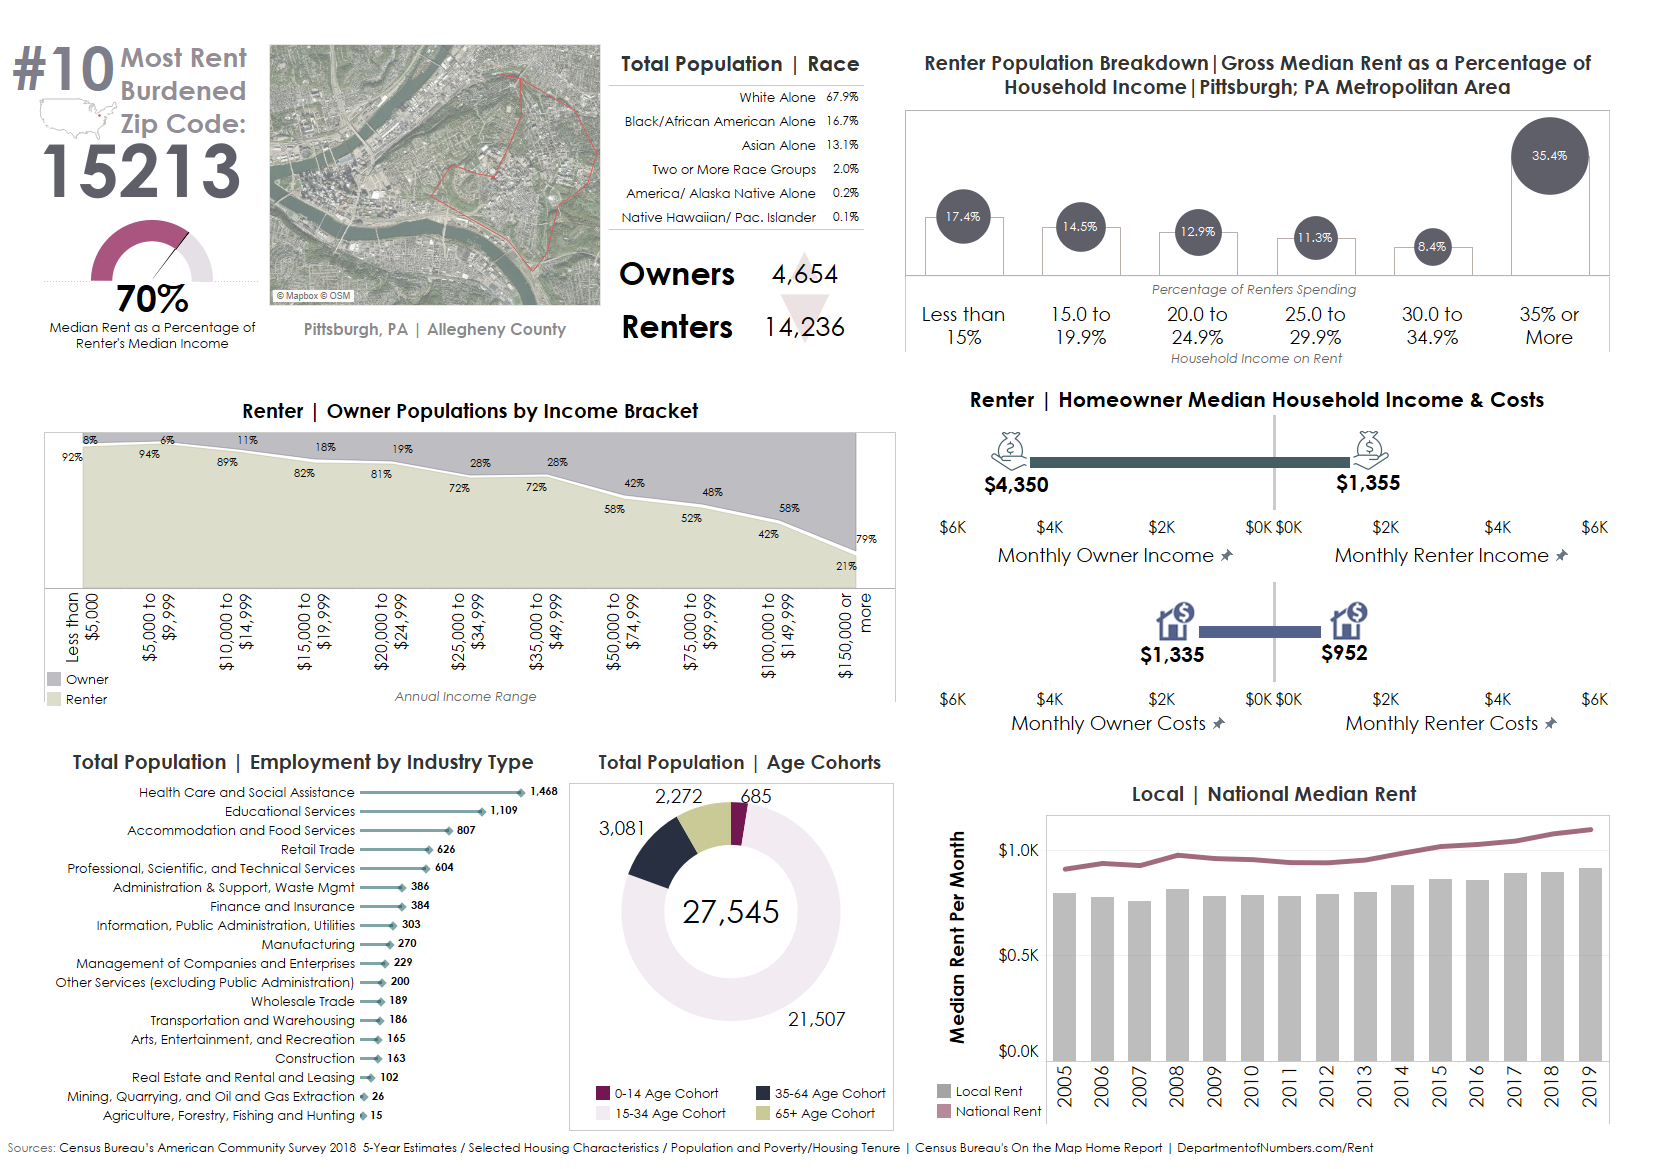
#10 - Zip code 15213
Pittsburgh; PA Metro Area
While most notable for its role in the industrial revolution as the nation's top steel manufacturer, Pittsburgh, Pennsylvania has successfully transitioned to a midsize terminal for the healthcare, education, and technology industries post mid-century industrialization. Today, Pittsburgh hosts 68 colleges and universities, including research and development industry leaders Carnegie Mellon University and the University of Pittsburgh Medical Centers. While the Steel City has evolved past its legacy of manufacturing, efforts to preserve its most foundational buildings and neighborhoods built during the city's industrial boom are compositional to the city's overall identity, harmonizing the old with the new.
This reverberating effect of neighborhood preservation, coupled with a high concentration of college campuses are likely contributing factors to the high rental cost burden in zip code 15213. As the academic and healthcare center of Pittsburgh, Oakland is also one of the city's major cultural centers, offering a variety of amenities, including shopping, restaurants, entertainment, recreational activities, and nightlife for students and young professionals. Within the neighborhood of Oakland is the Schenley Farms National Historic District, encompassing two city-designated historic districts: Schenley Farms, Oakland Civic Center Historic District, and the locally designated Oakland Square Historic District.
A 2015 study researching Pittsburgh's historic districts looked at significant investments in the city's Historic Landmarks over the past decade and tracked the change in property values within a 500-foot radius. That change in value was then compared to city-wide changes in value. The study found that property values within immediate proximity of historic landmarks went from trailing to exceeding the city-wide increases in value.
Investing in each landmark drove an increase in the appraised value of historic property which led to additional investments in nearby areas. This rippling effect, while beneficial to property owners, is burdensome for renters whose rental costs rise in relation to their landlord's property increasing in value.
Another possible explanation for an influx of cost-burdened renters could be from a large percentage of students entering the private real estate market in the absence of campus accommodations. Overall, zip code 15213 is a diverse mixed-use district with housing options ranging from locally protected, single-family historic dwellings to newly envisioned, urban high rises. However, this blend of the old and the new weighs heavily on the area's class of low-income renters.
The median gross rent is $952 per month; roughly 70% of a renter's median income of $1,355 per month. Based on this rent-to-income ratio: 15213 is listed as the #10 most cost-burdened zip code for renters in the United States.
Written and prepared by Amye Cutlip. Her Substack page is https://amyec3.substack.com/ and her email is amyetwitch@outlook.com for press inquiries.
Jason Schadewald and Brian Arguello assisted with editing.
Methodology and Sources:
Census Bureau's American Community Survey 5-Year Estimates |Table D04 Selected Housing Characteristics | Table B25064: Median Gross Rent (Dollars)
Data Filtered to Include All 5-digit ZIP Code Tabulation Areas within the United States
Renter's Cost Burden Calculation: Median gross rent for renter occupied units as a percentage of median household income of renter occupied units.
Datasets:
- Renter-occupied housing units paying cash rent: Median gross rent
- Occupied housing units: Median household income in the past 12 months (in 2018 inflation-adjusted dollars): Renter occupied
Data Selection: The top 10 percentages from the renters cost burden calculation
Further discussion:
Location within Metropolitan Area
Booming economies tend to have a reverberating effect on housing costs well outside the boundary of an economically thriving city. This upward pressure that is applied within the greater housing market leaves these low-wage renters consistently paying more to live while their wages remain stagnant.
A 2019 study from the Brookings Institution found that 44% of American workers between the ages of 18 to 64 qualify as low-wage employees, earning a median hourly wage of 10.22, or 18,000 a year. [1]
This study, which analyzed around 400 metropolitan areas, found that the proportion of low-wage earners ranges from 30-52% in a given region. The population of low-wage residents relates to the area's broader labor market conditions and industry composition. But the overarching theme of this study is clear: there are not enough jobs offering decent wages for people without college degrees to escape low-wage work.
Tourism Driving the Local Economy
One of the most common findings in the cost burden analysis was the local economy's reliance on the tourism industry. While a common economic driver in any labor market, a local economy driven by tourism disproportionately burdens local renters employed in this sector. Research from Florida State University found that employees in the tourism industry make the lowest earnings of any labor sector in the United States. [2]These findings also suggest that wages for hospitality workers have not kept pace with the rising economy, which adds an additional burden onto employees paying a higher cost of living due to their location within a greater metropolitan area or region. Tarik Dogru, assistant professor at FSU's Dedman School of Hospitality further explained: "Nationally, wages are rising more in other industries than the hospitality industry. For example, an average $1 increase in wages across the entire economy resulted in just an 81-cent pay hike for employees in the hospitality sector."The average weekly wage in other industries was 710 while in the leisure and hospitality industry was $311.
The Presence of College Campuses and Students
Another common finding from the cost burden analysis was 60% of the zip codes either neighbor a college campus or are the college campus. These findings are consistent with the findings from the Hechinger Report that students are experiencing undue cost burden across the country.
Between 2000 and 2017, room and board costs for students living off-campus rose 24 percent at public four-year universities after inflation, according to data from the National Center for Education Statistics analyzed by The Hechinger Report.
The increase may be one factor leaving a high percentage of college students "rent-burdened," defined as paying more than 30 percent of household income toward rent. Fifty-nine percent of homes with an undergraduate or graduate student as the head of the household met that definition in 2017, according to research from the Joint Center for Housing Studies at Harvard University. One notable caveat: students, especially those taking classes full time, typically use parental support, loans, or savings to pay rent, instead of income.[3]
Statistics from finance online found that in zip codes with at least one four-year college, the five-year median rent rose 5.8 percent for the period ending 2017 compared to the period ending 2015, according to Census data. The increase was just 4.5 percent in areas without a four-year institution.[4]
• Only 22% of university students in the US live in on-campus dormitories. 55% of US university students live in other types of rental housing, while the remaining 23% live in purpose-built, off-campus housing. (National Real Estate Investor, 2018)
• However, after the COVID-19 pandemic hit, the vacancy rate grew by 270 basis points to 7.9% in 2020. (Moody's Analytics, 2020)
• Numbering 8.6 million, student beds account for 12% of the total number of US rental units. (NMHC, 2020)
• The majority of student housing beds 61% is in the South, with 19% in the Midwest, 13% in the West, and the remaining 6% in the Northeast. (NMHC, 2020)
• Occupancy levels for on- and off-campus housing remain consistently high, with 2018 occupancy levels at 95%.
According to research from the Census Bureau, a higher concentration of student populations also has an impact on the area's poverty rate. Both in small counties with a large university and in large counties with multiple universities, the presence of college students who live off-campus raises the community's poverty rate.
Previous research showed smaller communities were more likely to have poverty rates affected by students who live off-campus. But new findings show a similar impact in some of the largest counties in the United States that are home to multiple colleges and universities.
Using updated American Community Survey 2012-2016 estimates, Census Bureau researchers found that in a number of areas, the inclusion of off-campus students had a statistically significant effect on local poverty rates, in some cases increasing the rate by 10 or more percentage points.[5]
Local Land Use Policies/Decisions
Another common finding from the cost burden analysis was the presence of local land-use decisions, particularly conservation and preservation efforts that could be driving up the cost of rent.
Conservation efforts to protect local ecology, while incredibly important for our natural environment, can also be a burden heavier to carry for low-income residents.
The following findings are from the Journal of Global Ecology and Conservation: Local Costs of Conservation Exceed those borne by the global majority: Whilst benefits of conservation accrue to the global community, significant costs are borne by those living closest. Where livelihoods depend upon opportunities forgone or diminished by conservation intervention, outcomes are limited. Activities can be displaced (leakage); rules can be broken (intervention does not work); or the intervention forces a shift in livelihood profiles (potentially to the detriment of local peoples' welfare). These raise concerns for both conservation and development outcomes and timely consideration of local costs is vital in conservation planning tools and processes.[6]
Moreover, a wide body of literature describes costs and risks to livelihoods that are associated with involuntary loss of (access to) land[7]. These are multi-dimensional, mediated through landlessness, joblessness, homelessness, marginalization, food insecurity, increased morbidity, loss of access to common property resources, community disarticulation, and loss of educational opportunities. [8]Conservation restrictions result in very significant costs to forest communities. The median net present value of the opportunity cost across households in all sites was US$2,375. When annualized, these costs represent 27-84% of total annual income for median-income households, significantly higher proportionally for poorer households.[9]
The costs and benefits of Historic and cultural preservation efforts are subject to considerable debate among special interest groups.
Proponents of preservation argue on behalf of economic viability and tourism, that in the author's opinion, unilaterally benefit property owners and homeowners. Proponents look to examples like San Antonio, Texas, evidencing that its historic districts not only generate more tourism dollars but also more construction jobs than other parts of the city. Continuing its historical preservation efforts, the city designated in September its most recent local historic district, an area known as East French Place with Craftsman bungalows built in 1922.
Furthermore, proponents of historic preservation believe that protecting the character of a neighborhood can have economic benefits. No matter the region of the U.S. or the wealth within a neighborhood, rates of real estate appreciation in local historic districts outpaces comparable neighborhoods and the city. Districts' property appreciation even outperforms those on the National Register.
The downside to rising property values is that it can price out residents, so cities turn to property tax relief for a designated historic property and community land trusts to help properties stay affordable[10].
Opponents of historic preservation from Manhattan argue that the city has designated far too many buildings and properties, some of questionable significance, and in so doing choked off development and raised maintenance costs, boosting rent.
"If landmarking practices of the previous decade continue, and without a serious look at the rules that govern development in historic districts, New York City runs the risk of further inhibiting housing production and preventing the city from meeting the housing needs of its growing population."[11]
Another opponent points out that historic zones tend to be wealthier and whiter than the rest of the borough. That matters because opponents of landmarking have sometimes characterized the districts as privileged reserves that are unfairly protected from market forces. Rent did rise more in historic districts compared with the rest of the city.[12]
Economic studies also found that historic districts tend to feature more economic activity than other areas, boast good energy efficiency, and are critical to the creative and tourism industries-all of which could reflect the heavy concentration of landmarked properties in a city's economic and tourist center.
Tying these concepts together, evidence how cost burden is disproportionately placed onto renters as evidenced from snippets taken directly from the Headwaters Economics study: Housing Affordability in Recreation Counties.
Many workers in these industries were already struggling to afford housing in the town where they work, especially if that town is in a recreation-dependent county. In growing communities across the United States, unaffordable housing has created a baseline of financial hardship that makes residents less able to weather disruptions from pandemics, natural hazards, and economic transitions.
Increasing wages accompany growth in higher-wage sectors such as technology and professional and scientific services, as well as booms in natural resource extraction. We find that non-metro counties with wages growing 10% faster between 2010 and 2018 have, on average, 2% greater share of wages going toward housing. This suggests that in places where wages are growing rapidly, competition for limited real estate may drive up housing costs faster than wages.
Rapid population growth from new residents is the strongest predictor of housing affordability. As people move to a community, housing becomes less affordable, particularly for renters. In non-metro counties, as the net migration rate increases by 10%, the share of wages spent on mortgages increases by 7%, and the share spent on rent increases by 10%. This relationship likely reflects higher competition for housing, as well as likely speculation by real estate investors buying properties for the rental market.
Since 2010, non-metro recreation counties have seen an average 2% rate of in-migration, while non-metro counties that are not recreation-dependent have experienced a 2% rate of out-migration. This trend may be exacerbated by the pandemic as people leave metropolitan areas for less crowded destinations.
"Recreation counties" using the definition for recreation dependence by the U.S. Department of Agriculture's Economic Research Service. ERS's definition is based on employment and earnings from tourism-related sectors and a high share of seasonal and vacation housing.
"Non-metro" counties are places without a city of 50,000 or more residents and without a large share of residents commuting to large cities, as defined by the Office of Management and Budget. We exclude metro counties from this analysis because their housing markets and economies are more complex and require a different modeling strategy than non-metro counties.
After accounting for measurable community factors, residents of non-metro recreation counties pay a higher share of wages on housing: 4% higher for mortgages and 6% higher for rents on average.
[1] https://www.brookings.edu/blog/the-avenue/2019/11/21/low-wage-work-is-more-pervasive-than-you-think-and-there-arent-enough-good-jobs-to-go-around/
[2] https://phys.org/news/2019-08-tourism-industry-lowest-wages-nationwide.html
[3] https://hechingerreport.org/the-hidden-risk-in-off-campus-housing-costs/
[4] https://financesonline.com/student-housing-statistics/
[5] https://www.census.gov/library/stories/2018/10/off-campus-college-students-poverty.html
[6] https://www.sciencedirect.com/science/article/pii/S2351989417302366
[7] https://peerj.com/articles/5106/
[8] https://peerj.com/articles/5106/
[9] https://peerj.com/articles/5106/
[10] https://www.usnews.com/news/best-states/articles/2017-11-22/preserving-history-boosts-local-economies
[11] https://citylimits.org/2016/06/01/new-research-on-how-historic-districts-affect-affordable-housing/
[12] https://citylimits.org/2016/06/01/new-research-on-how-historic-districts-affect-affordable-housing/