Home prices hit a new all-time high as it became even more common for homes to find buyers within one week.
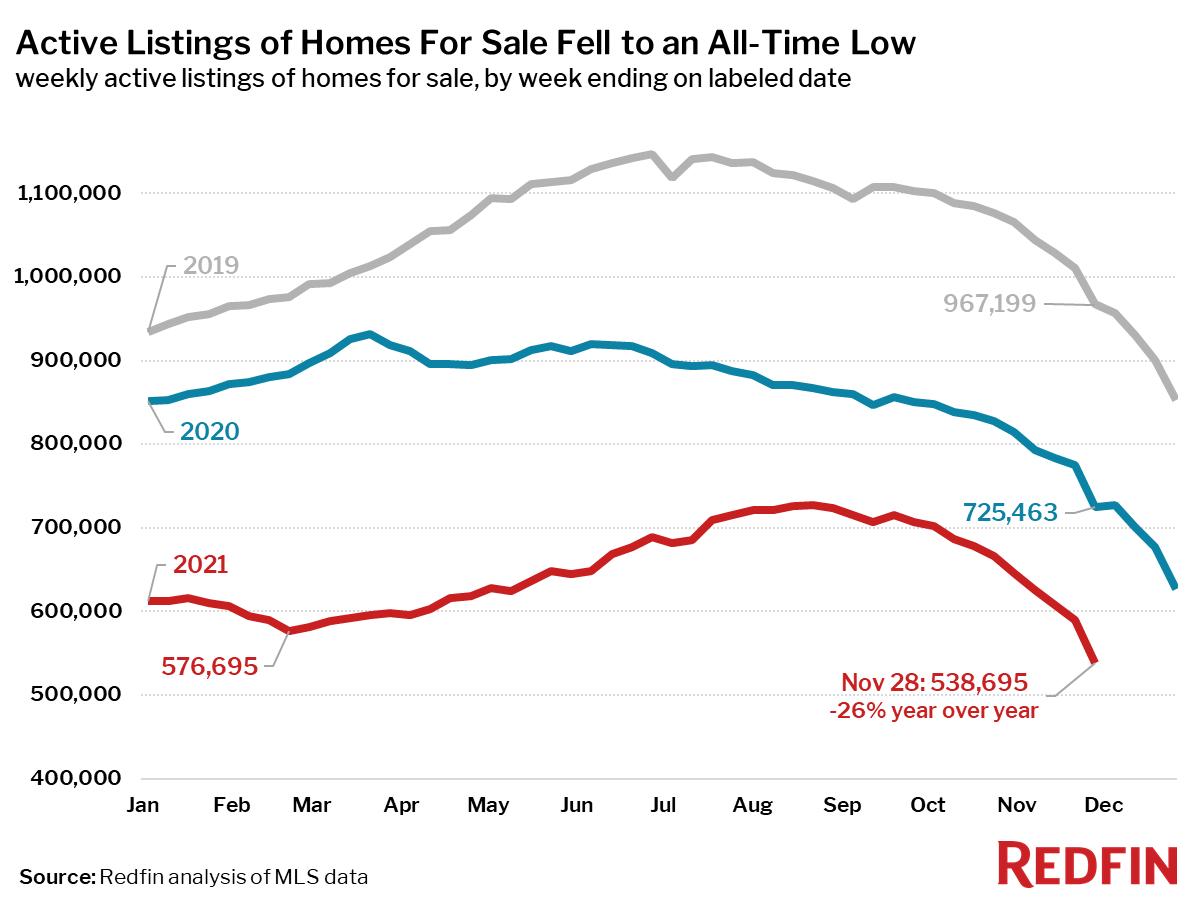
The number of homes for sale hit an all-time low during the week ending November 28, suggesting a difficult winter is in store for homebuyers. During the four-week period, sustained demand pushed the median home price to another record high, and a third of homes sold in one week or less.
“The number of homes for sale typically declines another 15% in December,” said Redfin Chief Economist Daryl Fairweather. “That means that by the end of the year, there will likely be 100,000 fewer homes for sale than there were in February when housing supply last hit rock bottom. I think more new listings will hit the market in the new year, but there will also be a long line of buyers who are queuing up right now.”
“Meanwhile, headlines and new restrictions related to the omicron variant of the coronavirus might fuel some uncertainty and volatility in the economy,” Fairweather continued. “In the short term, global interest rates, including mortgage rates, could fall. In this extremely tight housing market, we would quickly see a proportional increase in competition and home prices.”
Key housing market takeaways for 400+ U.S. metro areas:
Unless otherwise noted, the data in this report covers the four-week period ending November 28. Redfin’s housing market data goes back through 2012. Comparing today’s market with the pre-pandemic fall market of 2019 highlights how hot the market remains, even as most measures are settling into typical seasonal patterns.
Data based on homes listed and/or sold during the period:
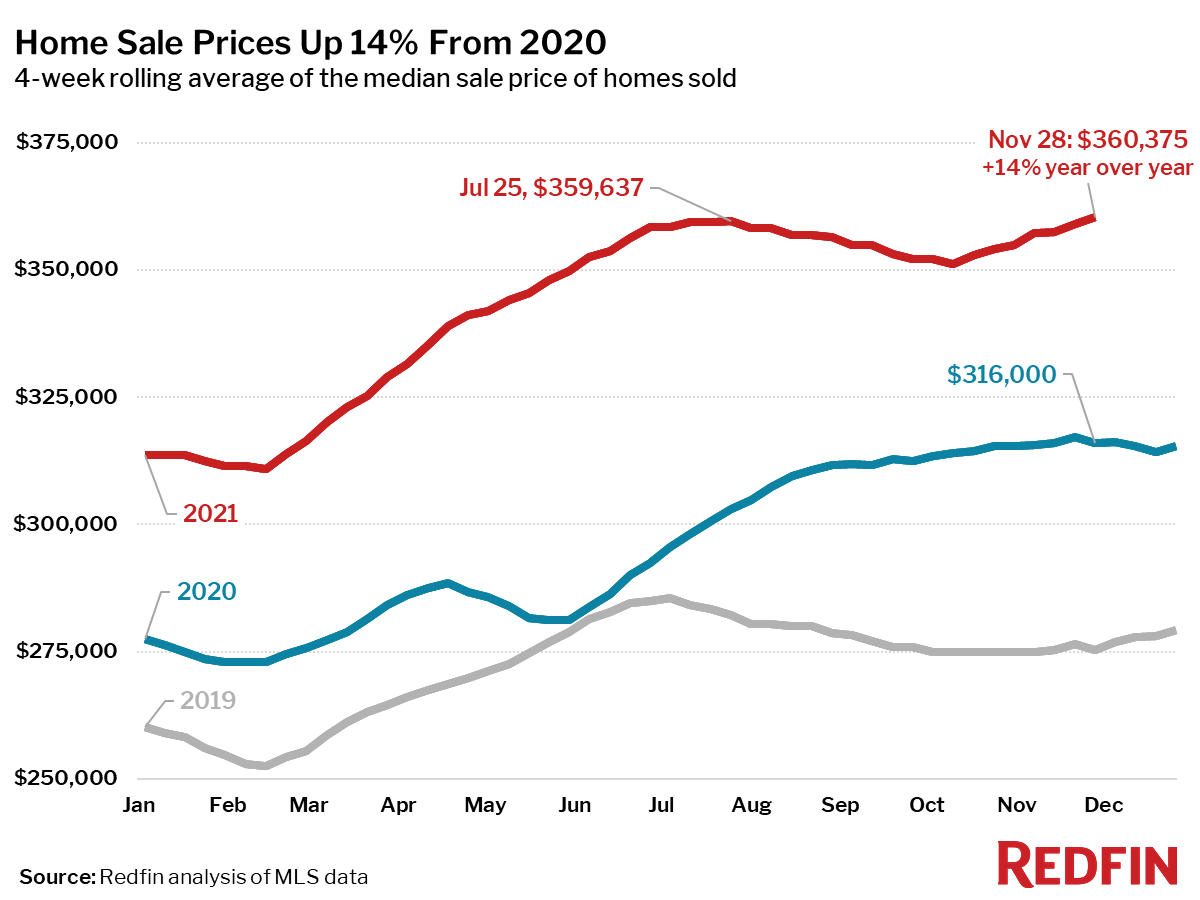
- The median home-sale price hit a new all-time high of $360,375, up 14% year over year. This was up 31% from the same period in 2019 and up 1.5% from a month earlier, far greater than the 0.2% increase seen during the same period last year.
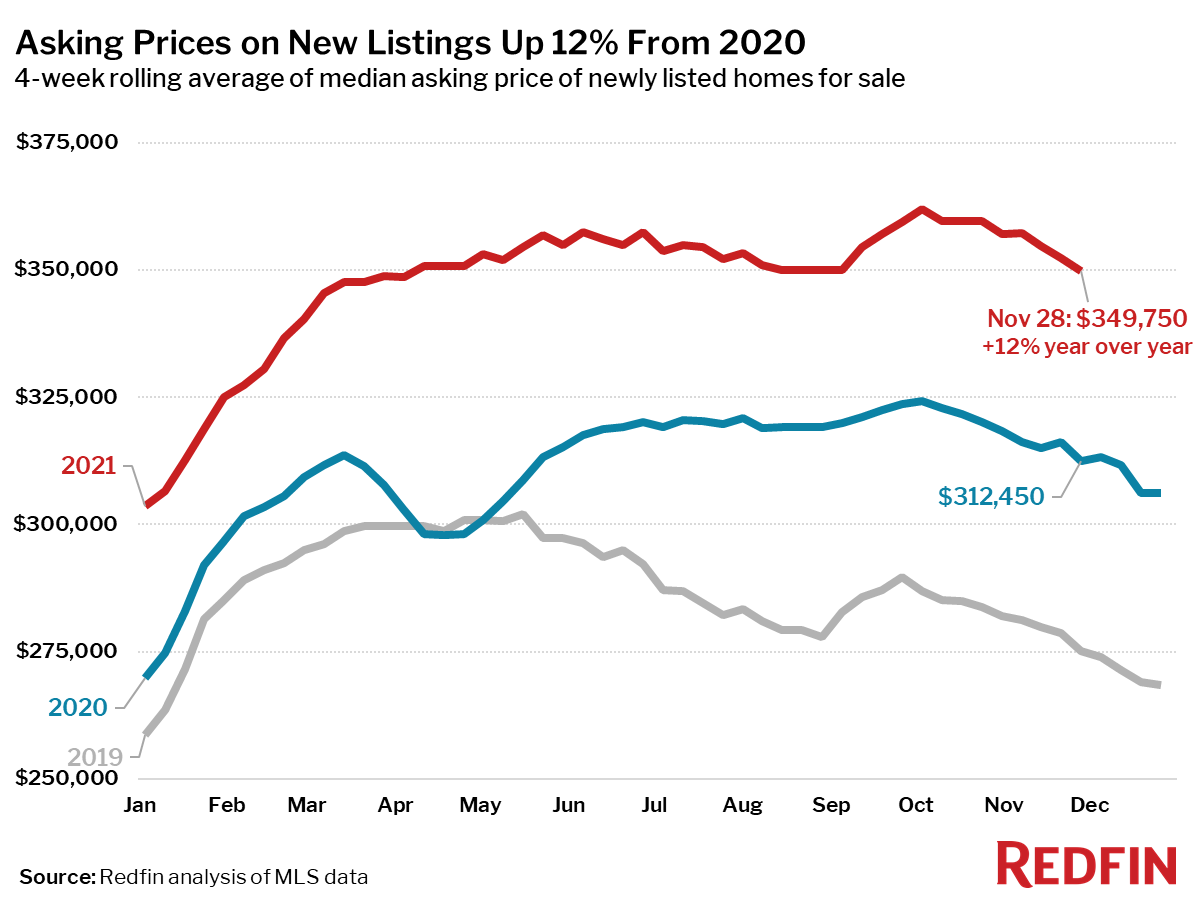
- Asking prices of newly listed homes were up 12% from the same time a year ago and up 27% from 2019 to a median of $349,750.
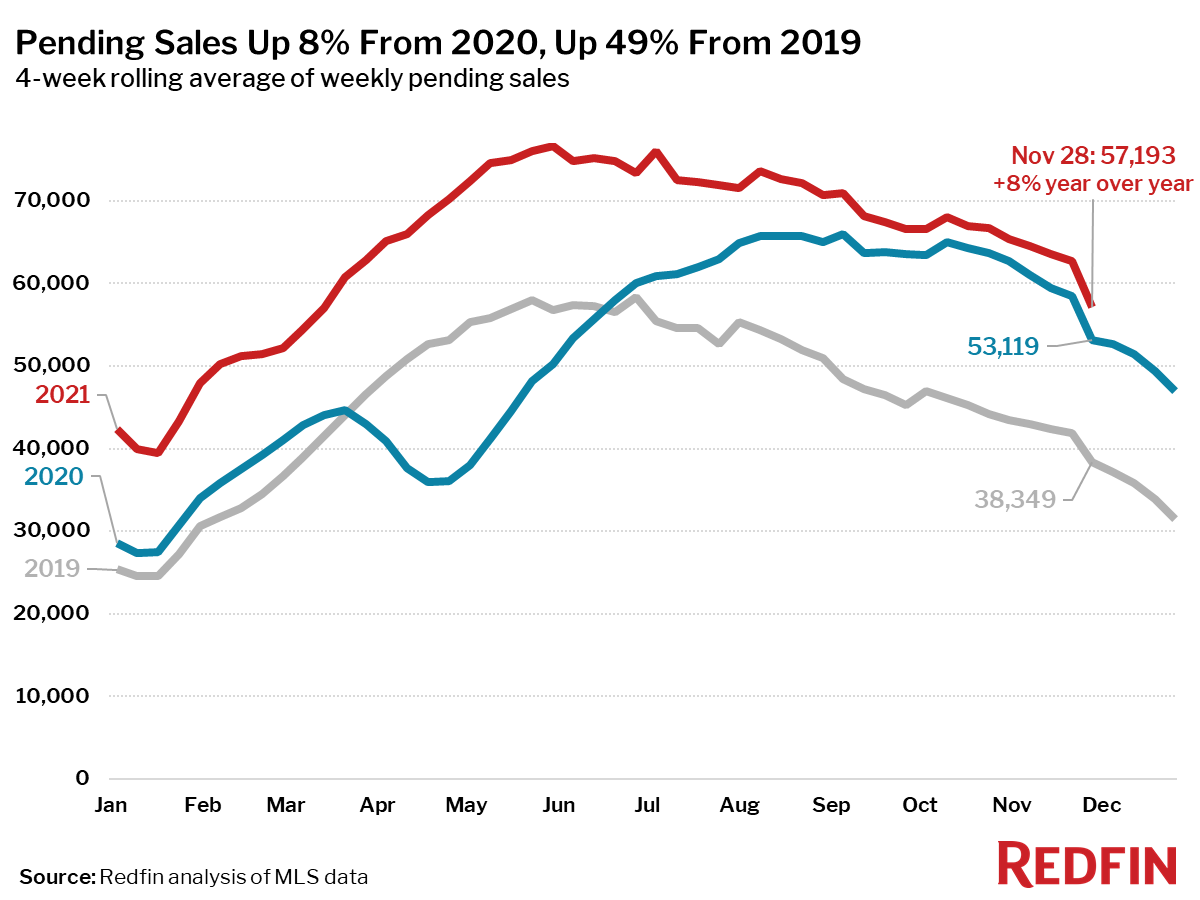
- Pending home sales were up 8% year over year, and up 49% compared to the same period in 2019.
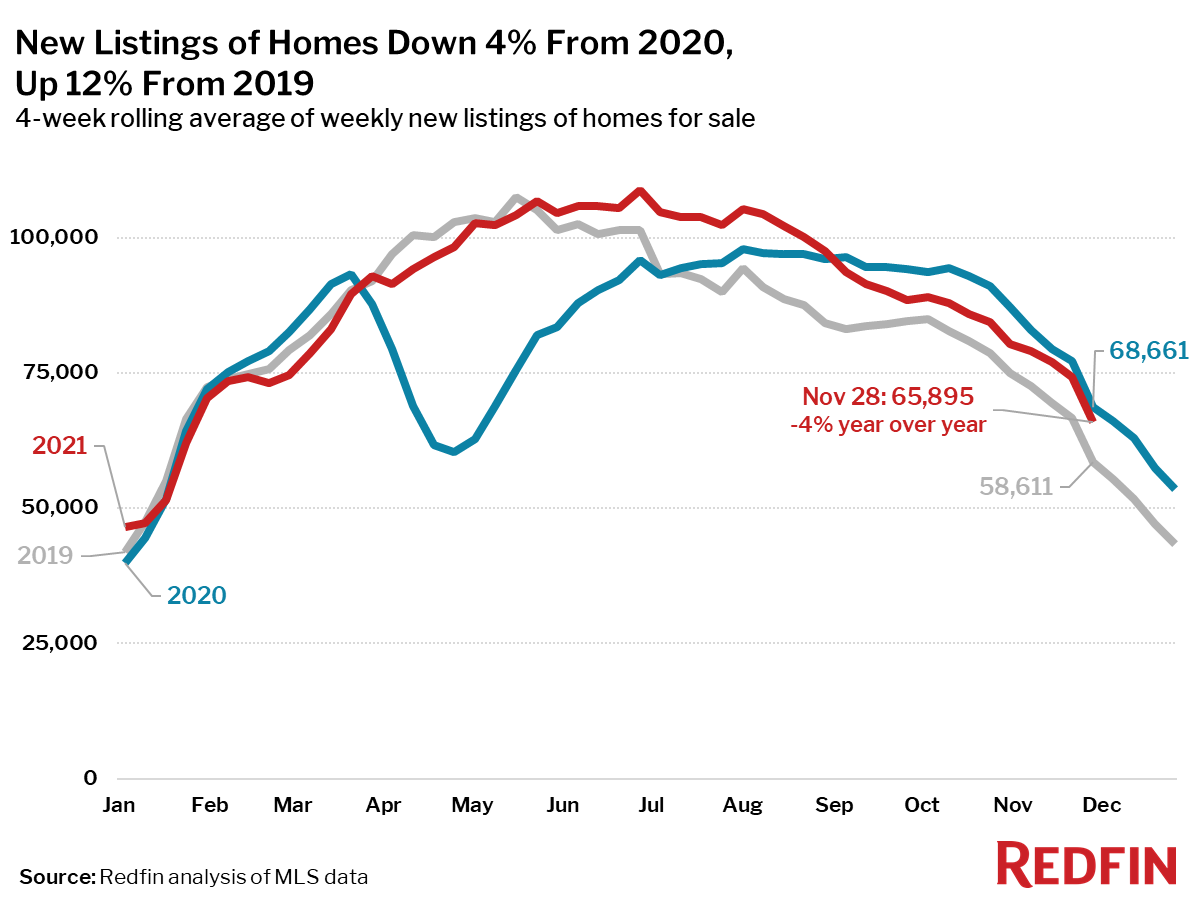
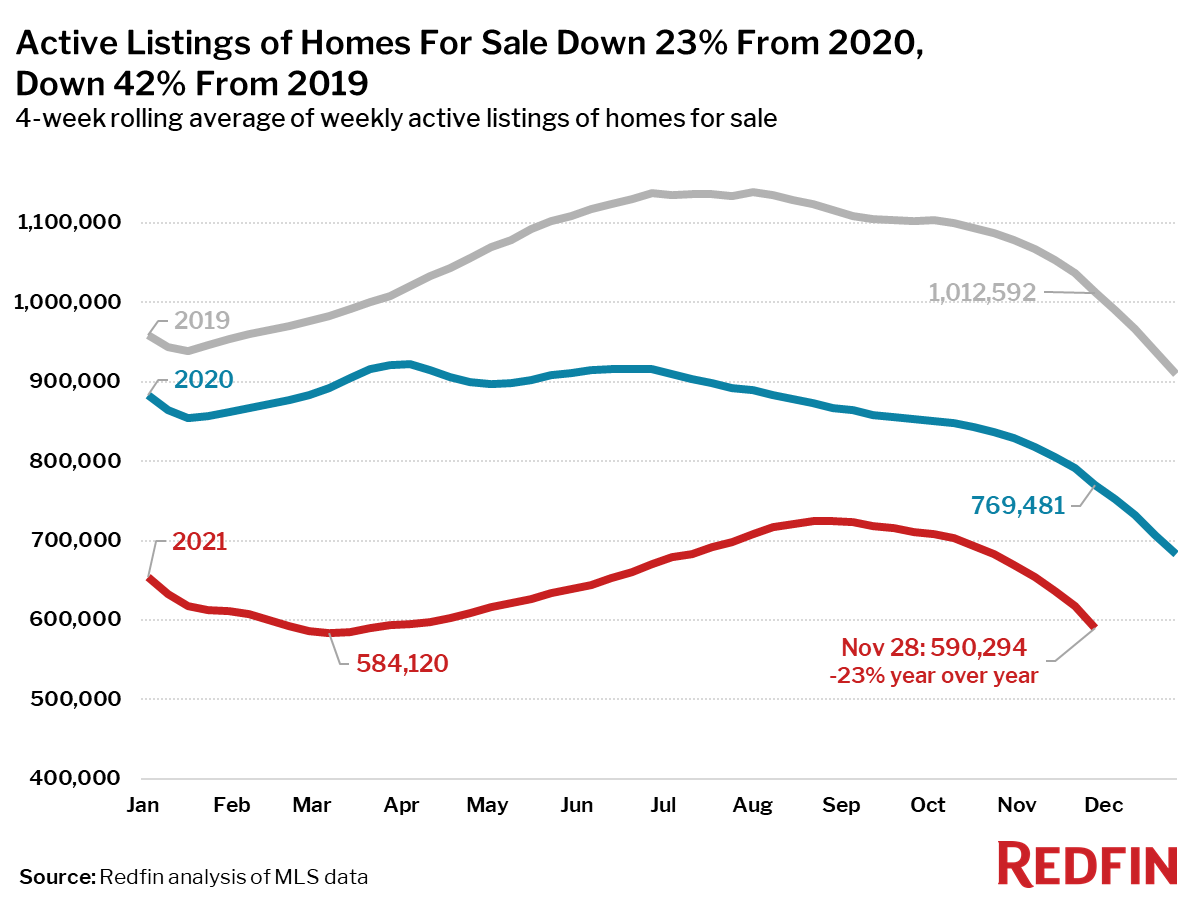
- New listings of homes for sale were down 4% from a year earlier, but up 12% from 2019.During the seven-day period ending November 28, active listings (the number of homes listed for sale at any point during the period) fell to a new all-time low. For the four-week period, active listings fell 23% from 2020 and 42% from 2019.
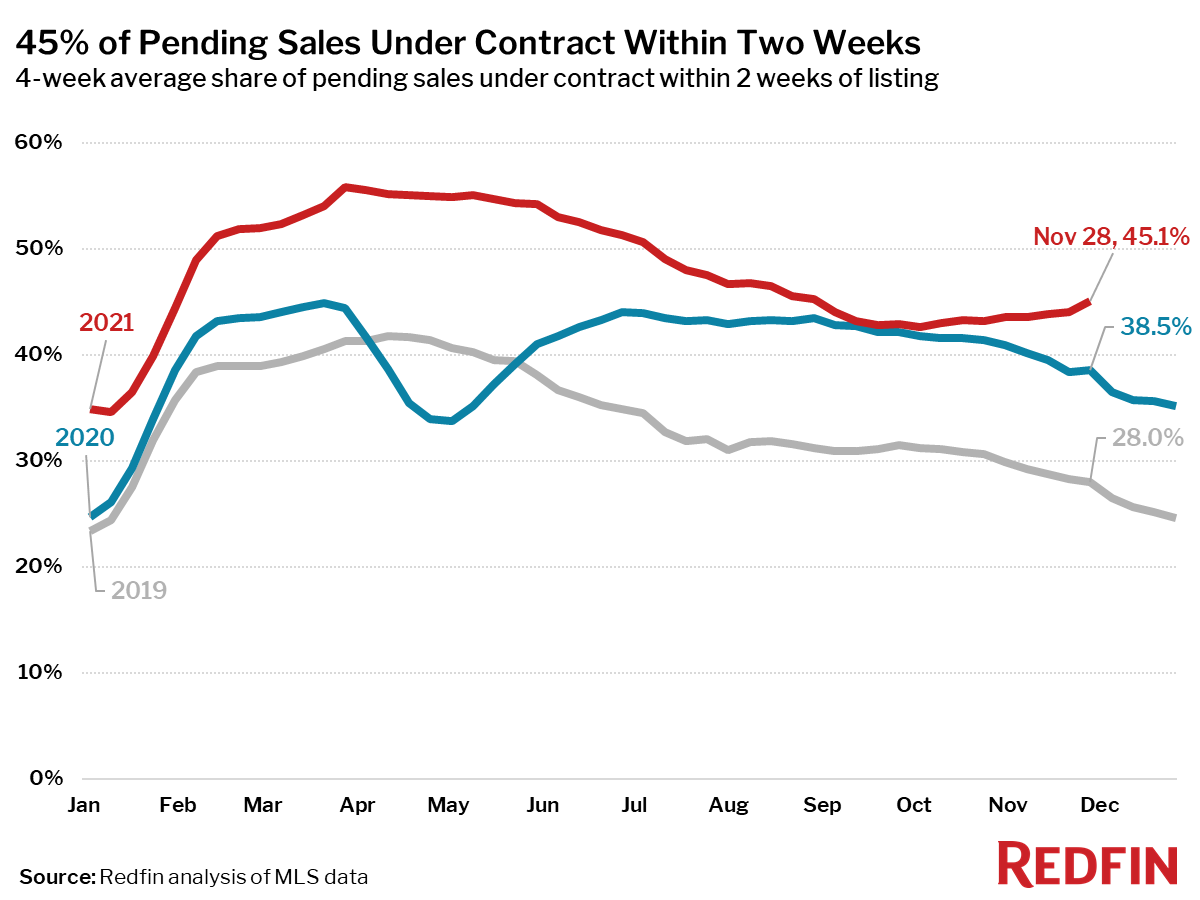
- 45% of homes that went under contract had an accepted offer within the first two weeks on the market, above the 39% rate of a year earlier and the 28% rate in 2019. Since the four-week period ending September 19, the share of homes under contract within two weeks is up 2.3 percentage points. During the same time in 2019, the share fell 3.1 points.
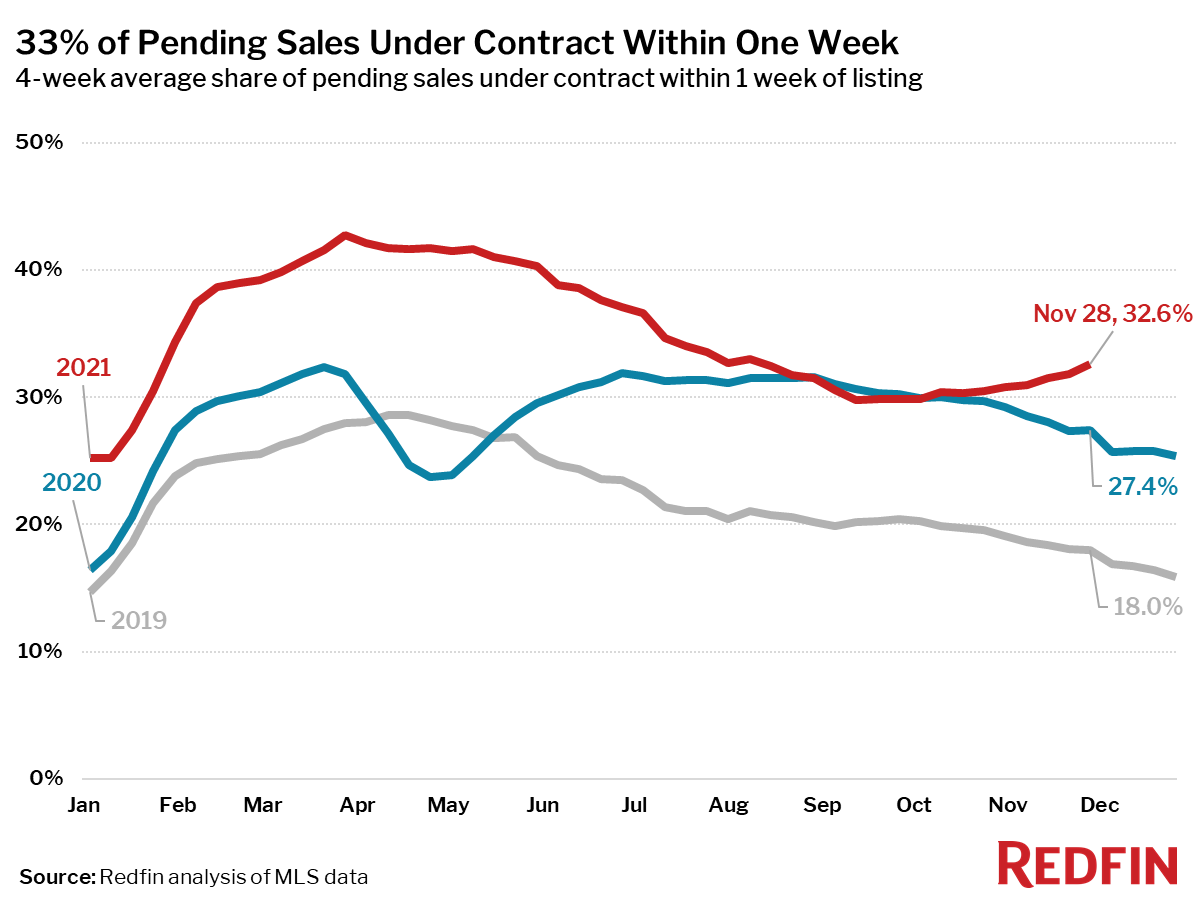
- 33% of homes that went under contract had an accepted offer within one week of hitting the market, up from 27% during the same period a year earlier and 18% in 2019. Since the four-week period ending September 12, the share of homes under contract within a week is up 2.9 percentage points. During the same time in 2019, the share fell 2.3 points.
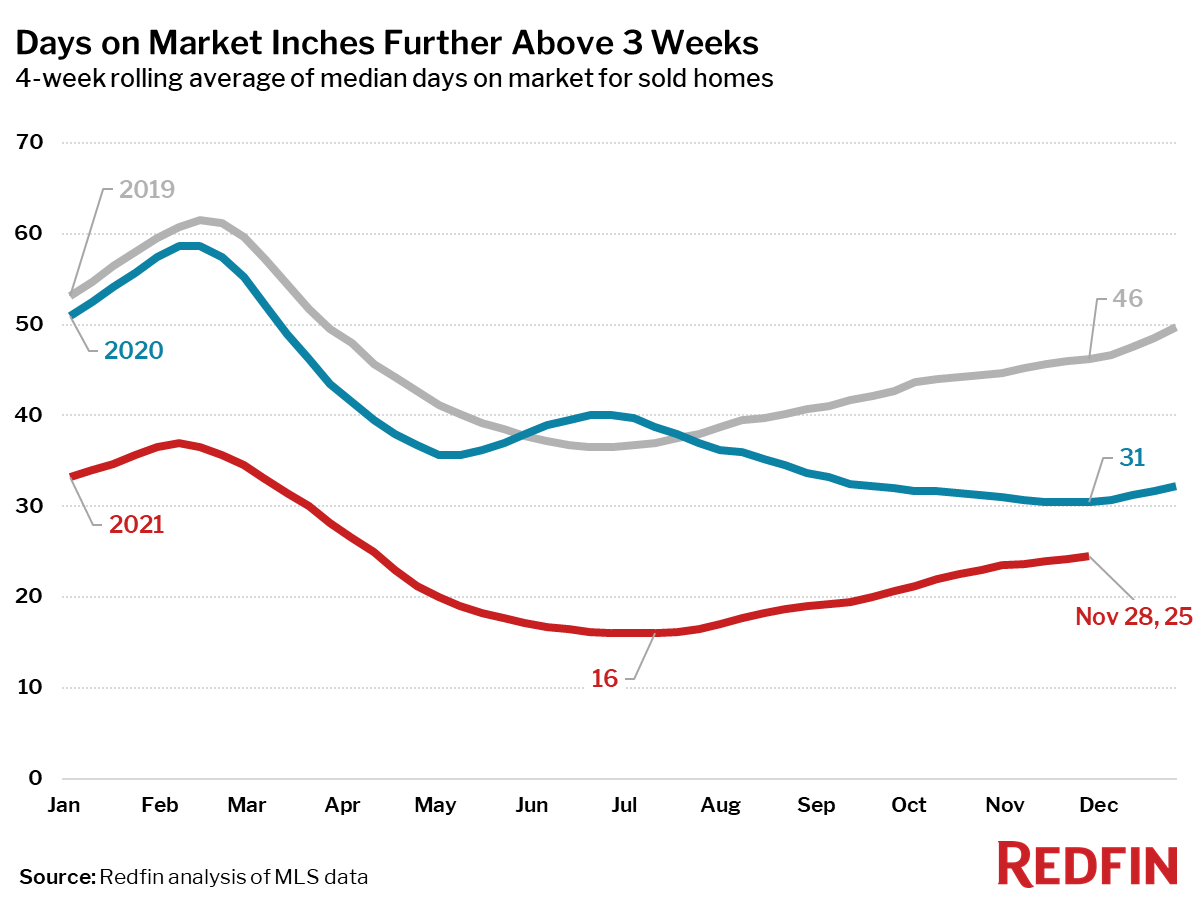
- Homes that sold were on the market for a median of 25 days, down from 31 days a year earlier and 46 days in 2019.
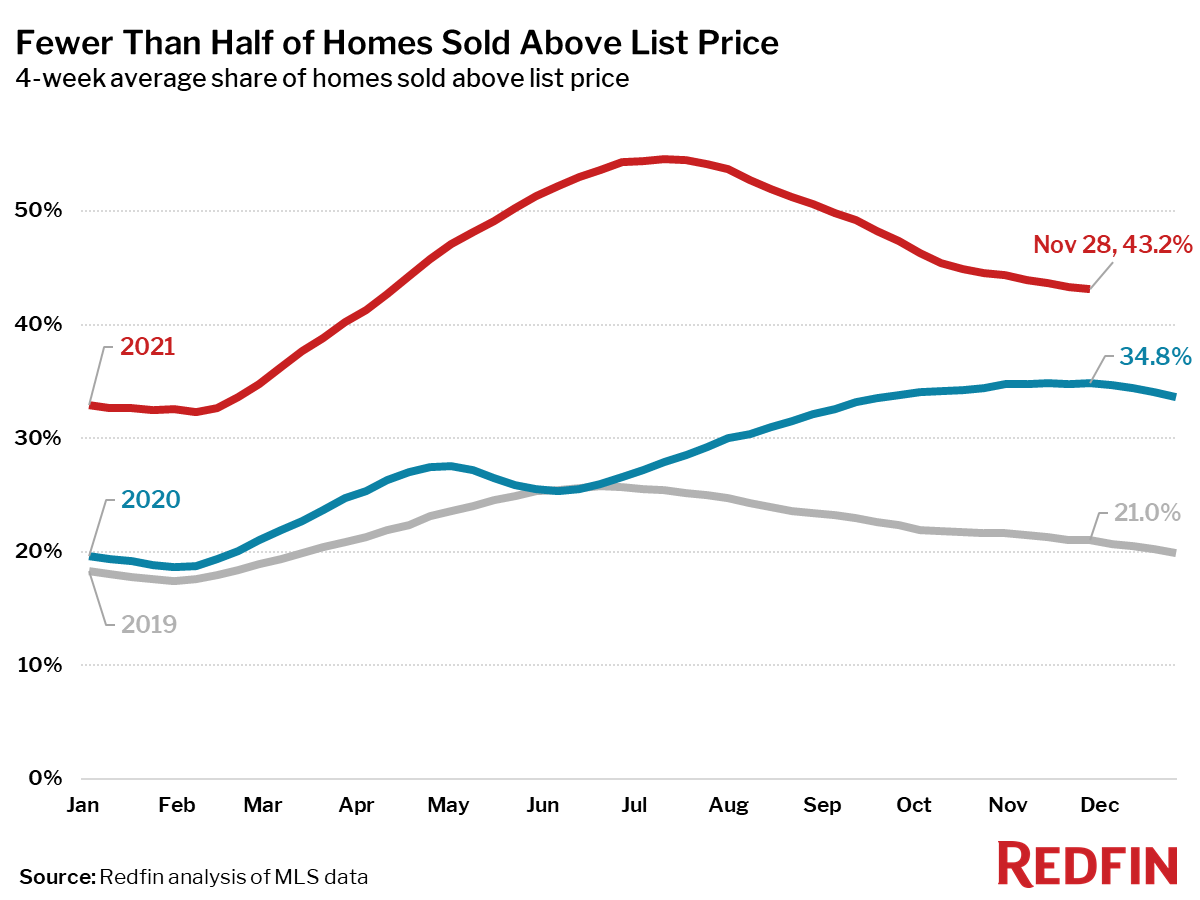
- 43% of homes sold above list price, up from 35% a year earlier and 21% in 2019.
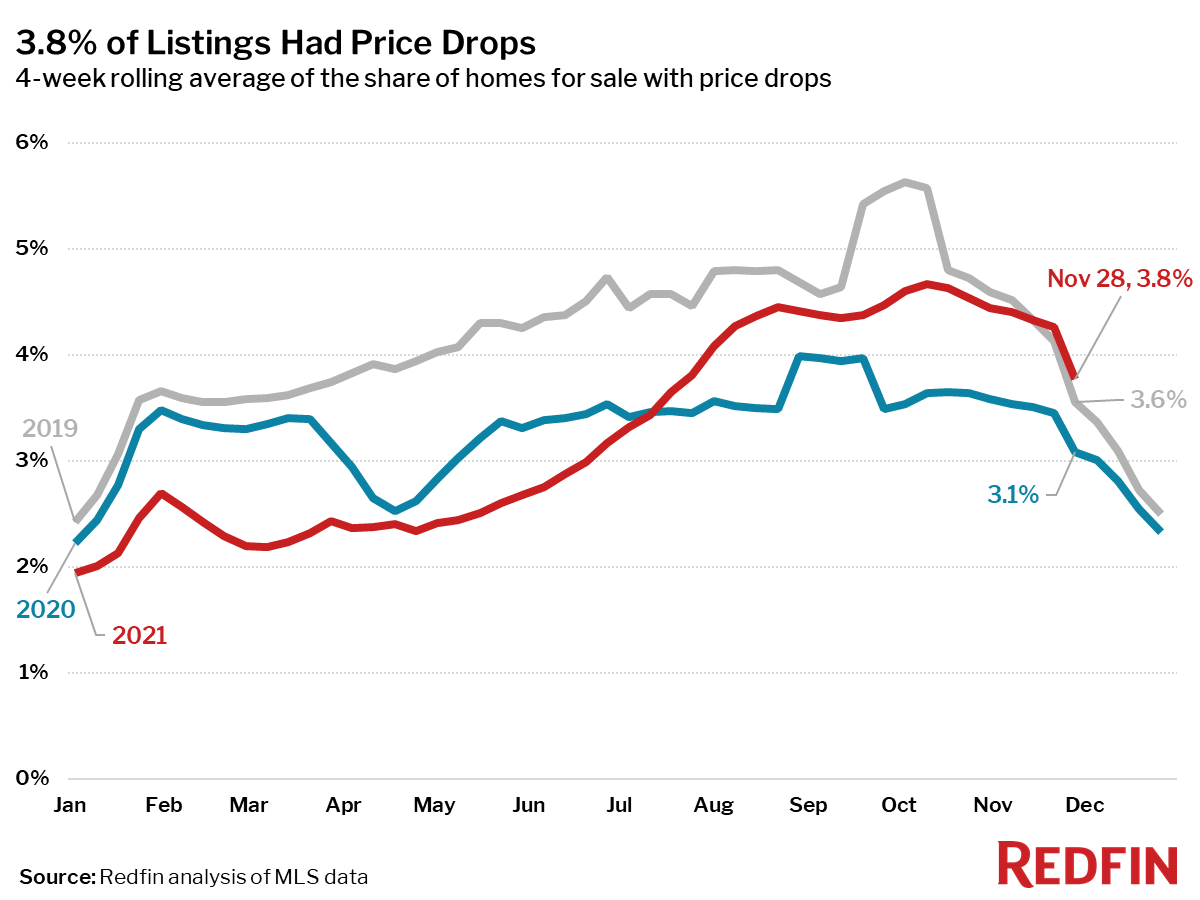
- On average, 3.8% of homes for sale each week had a price drop, up 0.7 percentage points from the same time in 2020 and up 0.2 points from this time in 2019.
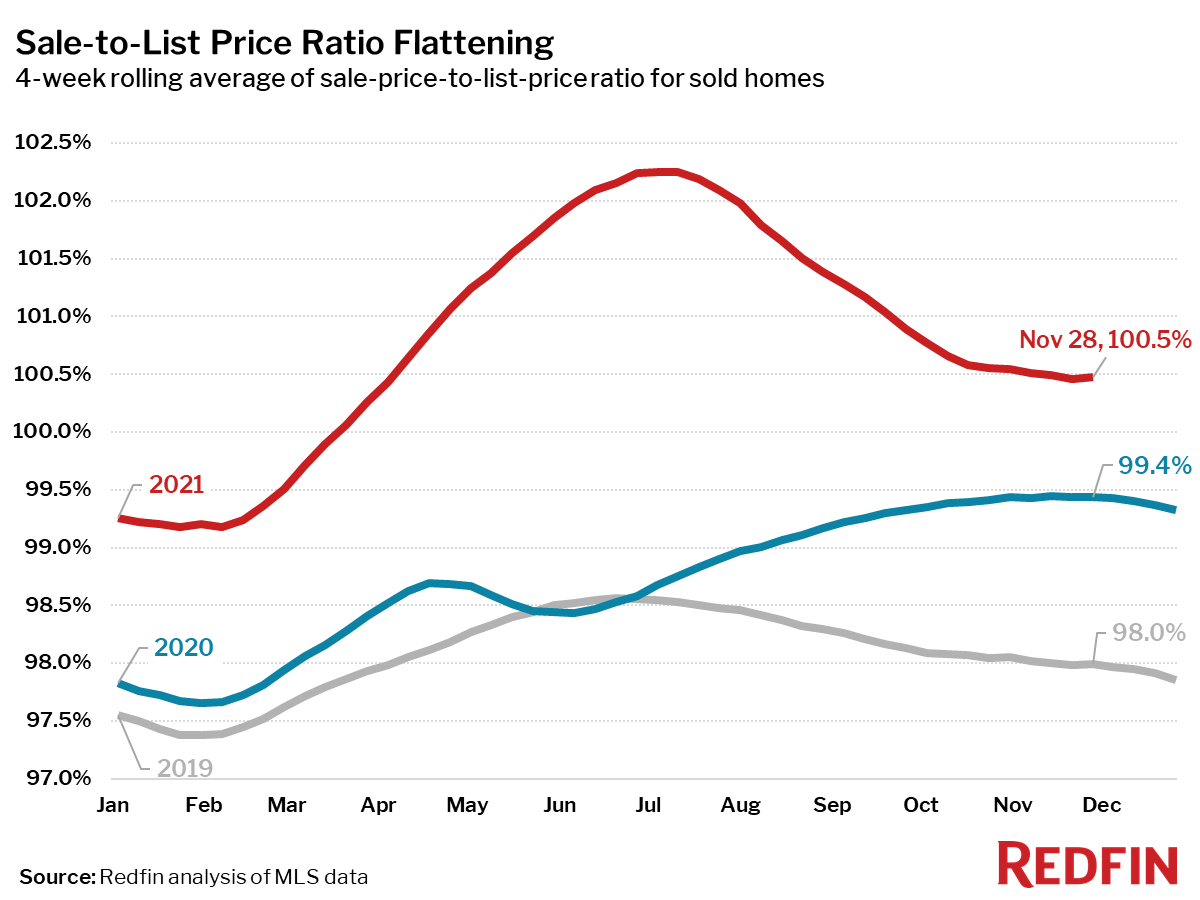
- The average sale-to-list price ratio, which measures how close homes are selling to their asking prices, was 100.5%. In other words, the average home sold for 0.5% above its asking price.
Other leading indicators of homebuying activity:
- Mortgage purchase applications increased 5% week over week (seasonally adjusted) during the week ending November 26. For the week ending November 24, 30-year mortgage rates were flat at 3.1%.
- Touring activity through November 21 fell about 1 percentage point behind 2019 relative to the first week of January according to home tour technology company ShowingTime.
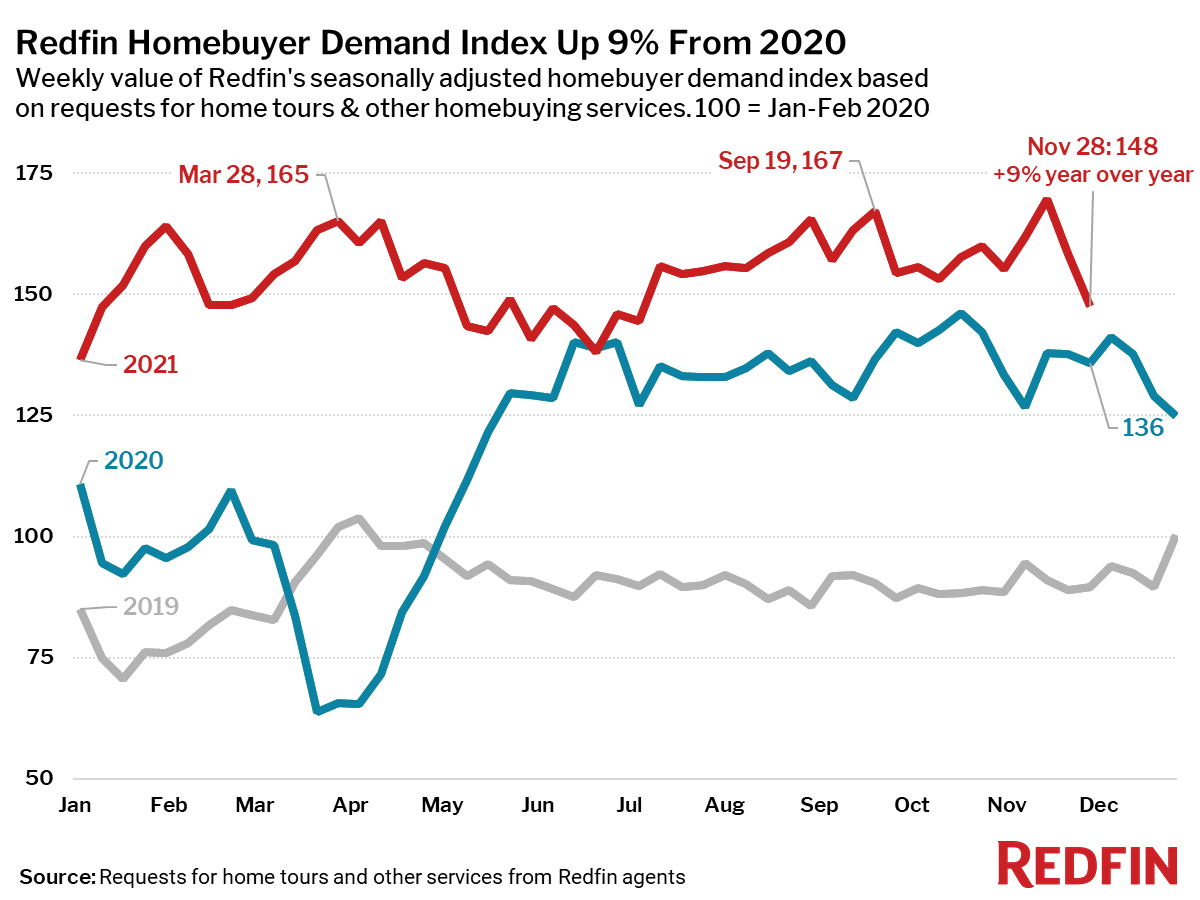
- The Redfin Homebuyer Demand Index fell 7% during the week ending November 28 but was up 9% from a year earlier. The seasonally adjusted Redfin Homebuyer Demand Index is a measure of requests for home tours and other home-buying services from Redfin agents.
Refer to our metrics definition page for explanations of all the metrics used in this report.
 United States
 Canada