Homebuyers, on the other hand, face a market that is already heating back up with a third of homes selling in just one week.
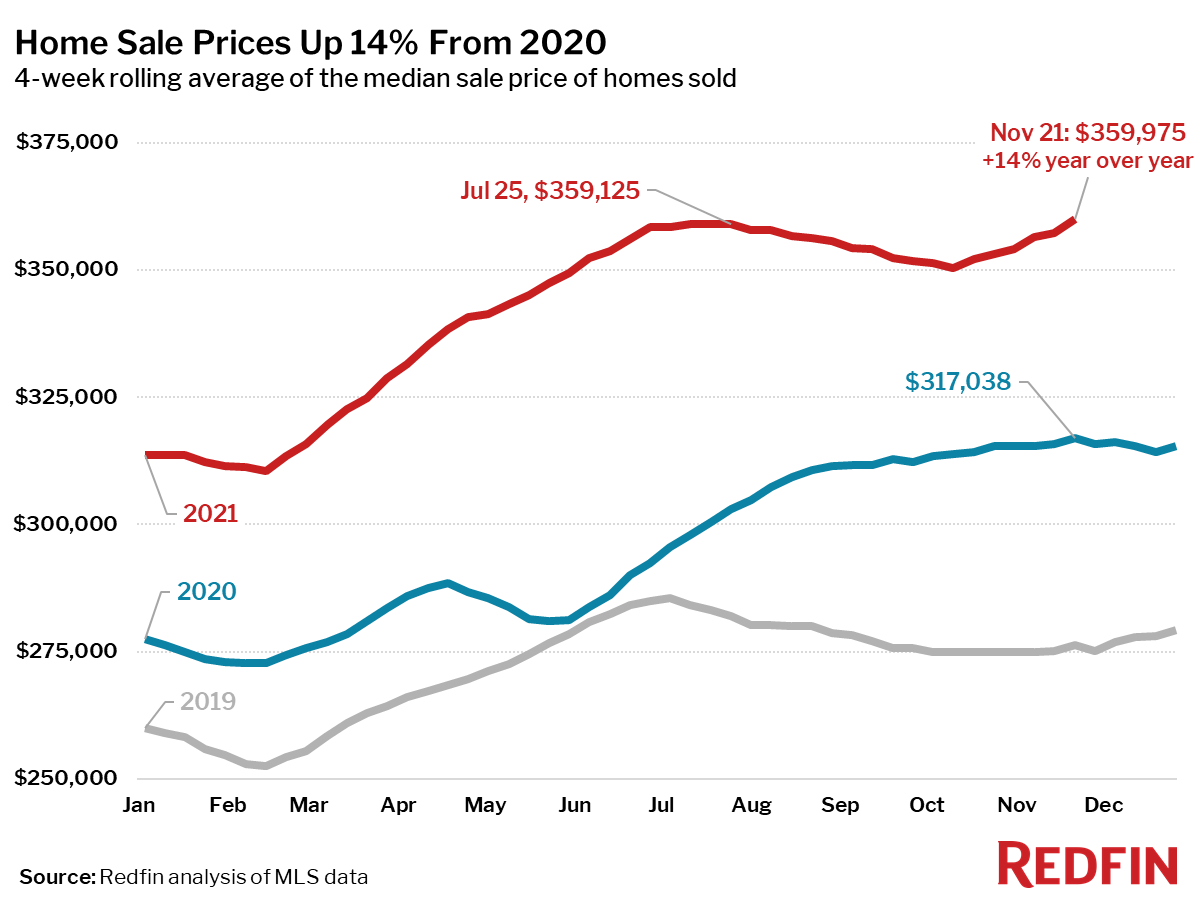
Home prices hit a new all-time high of $359,975 in the four-week period ending November 21. This was up 14% year over year, the largest increase since early September. Prices have risen in the past month nearly four times faster than they did at the same time last year. The unseasonable surge in home prices appears to be drawing in more sellers, as the number of homes listed for sale was down less than 3% from 2020, and up 11% from 2019.
“Rising rents and rising prices on everything from gas to groceries may be motivating more people to buy homes now,” said Redfin Chief Economist Daryl Fairweather. “Buying a home is a type of hedge against inflation, especially with mortgage rates still near historic lows. If high inflation persists, a large home mortgage could seem a lot less expensive in just a few years.”
Key housing market takeaways for 400+ U.S. metro areas:
Unless otherwise noted, the data in this report covers the four-week period ending November 14. Redfin’s housing market data goes back through 2012. Comparing today’s market with the pre-pandemic fall market of 2019 highlights how hot the market remains, even as most measures are settling into typical seasonal patterns.
Data based on homes listed and/or sold during the period:
- The median home-sale price hit a new all-time high of $359.975, up 14% year over year. This was up 30% from the same period in 2019 and up 1.9% from a month earlier, which was nearly four times faster growth than the 0.5% increase seen during the same period last year.
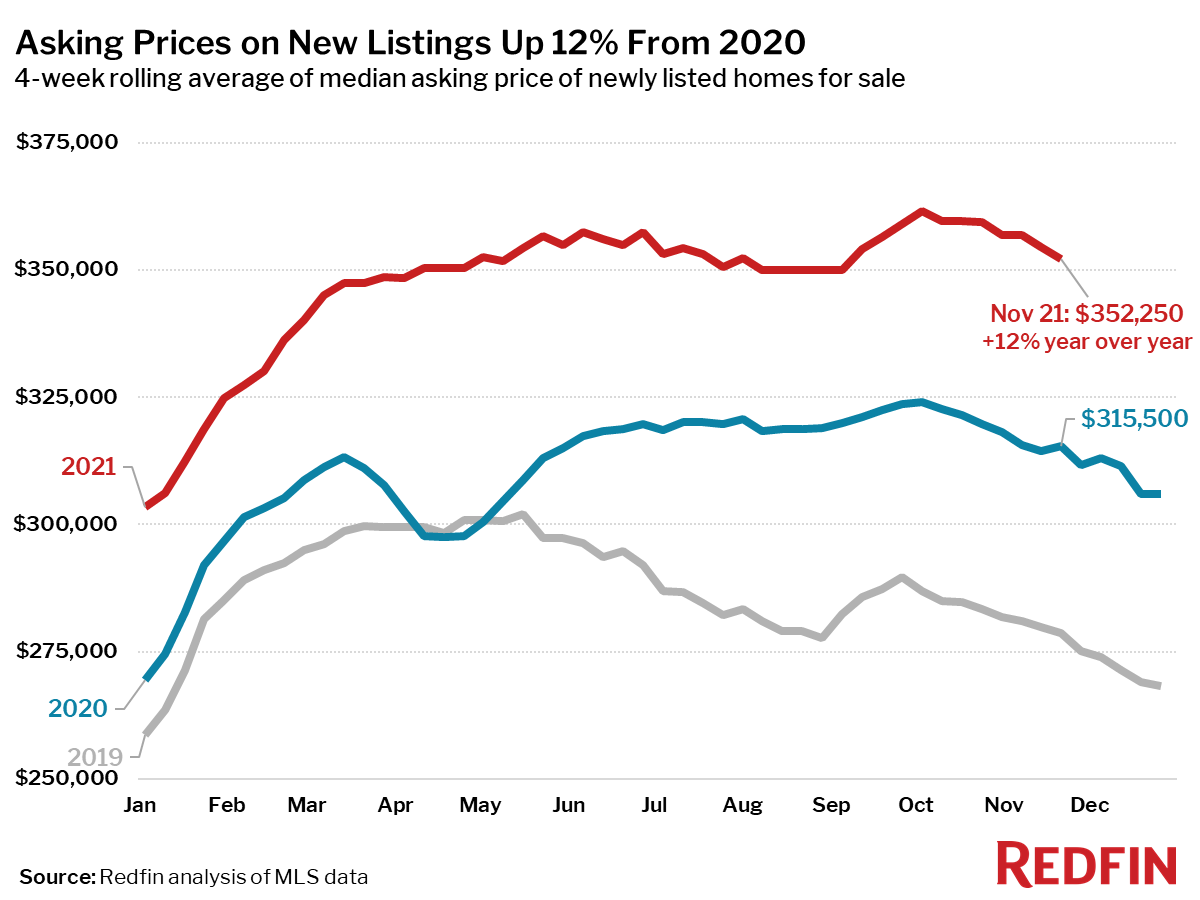
- Asking prices of newly listed homes were up 12% from the same time a year ago and up 26% from 2019 to a median of $352,250.
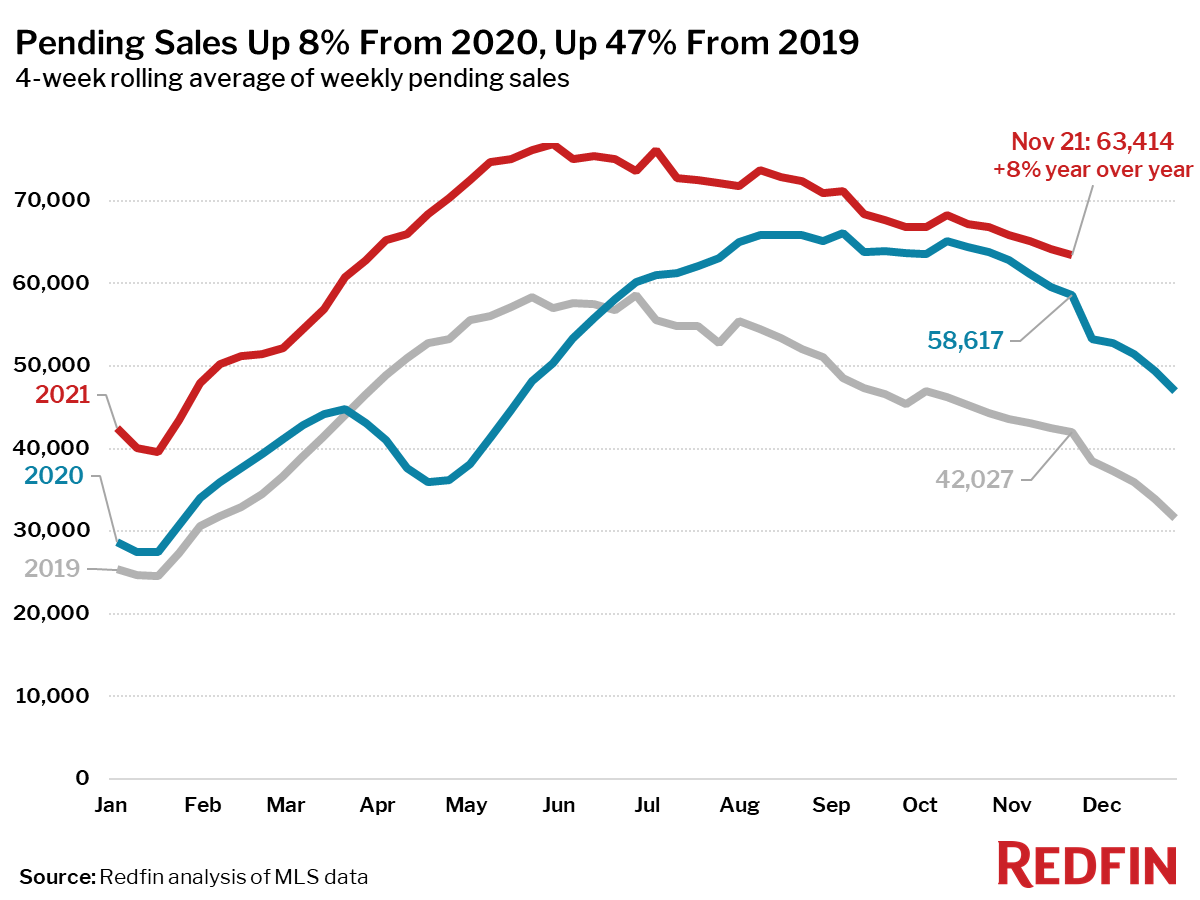
- Pending home sales were up 8% year over year, and up 51% compared to the same period in 2019.
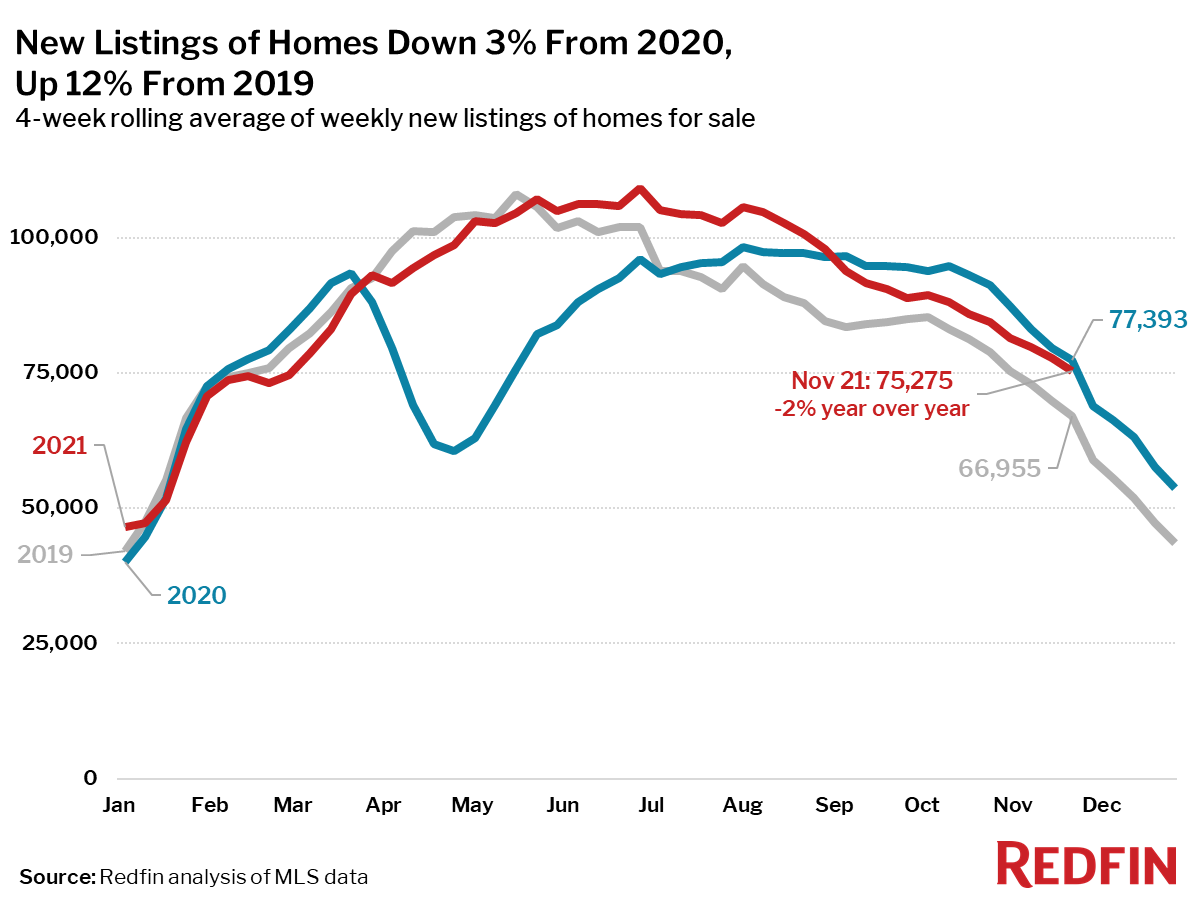
- New listings of homes for sale were down 2.7% from a year earlier, but up 12% from 2019. Since the four-week period ending October 3, new listings are down 16%, a smaller decline than over the same period in 2019 (-21%) and in 2020 (-18%).
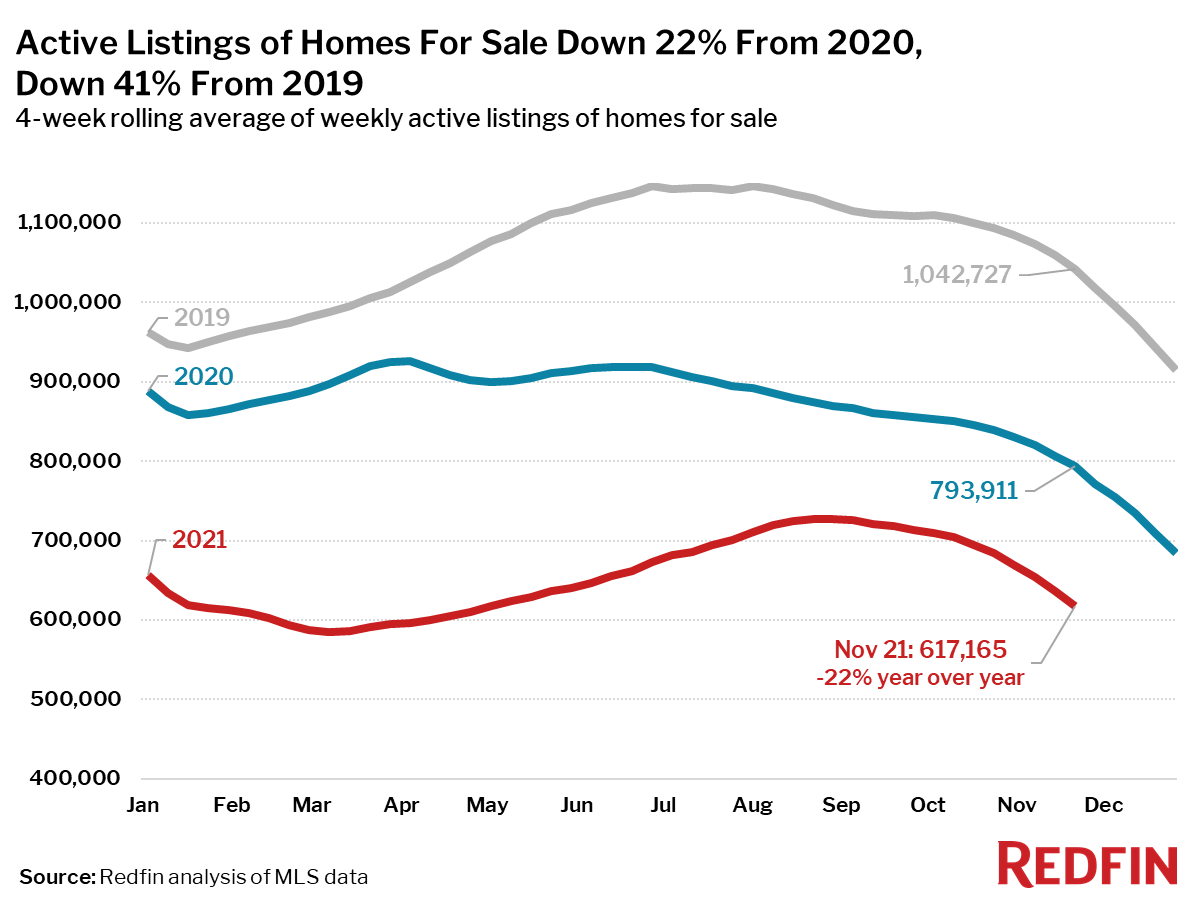
- Active listings (the number of homes listed for sale at any point during the period) fell 22% from 2020 and 41% from 2019.
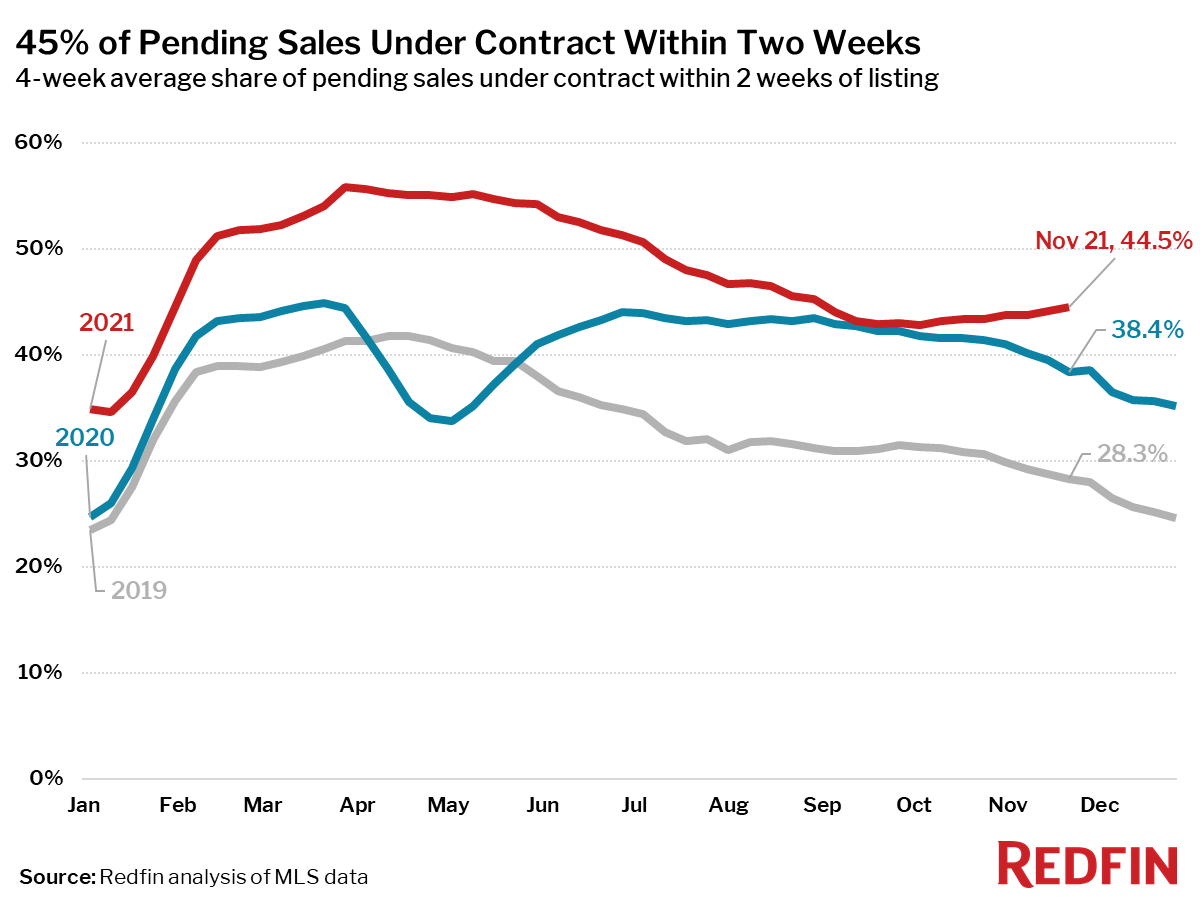
- 45% of homes that went under contract had an accepted offer within the first two weeks on the market, above the 39% rate of a year earlier and the 28% rate in 2019. Since the four-week period ending September 19, the share of homes under contract within two weeks is up 1.6 percentage points. During the same time in 2019, the share fell 2.9 points.
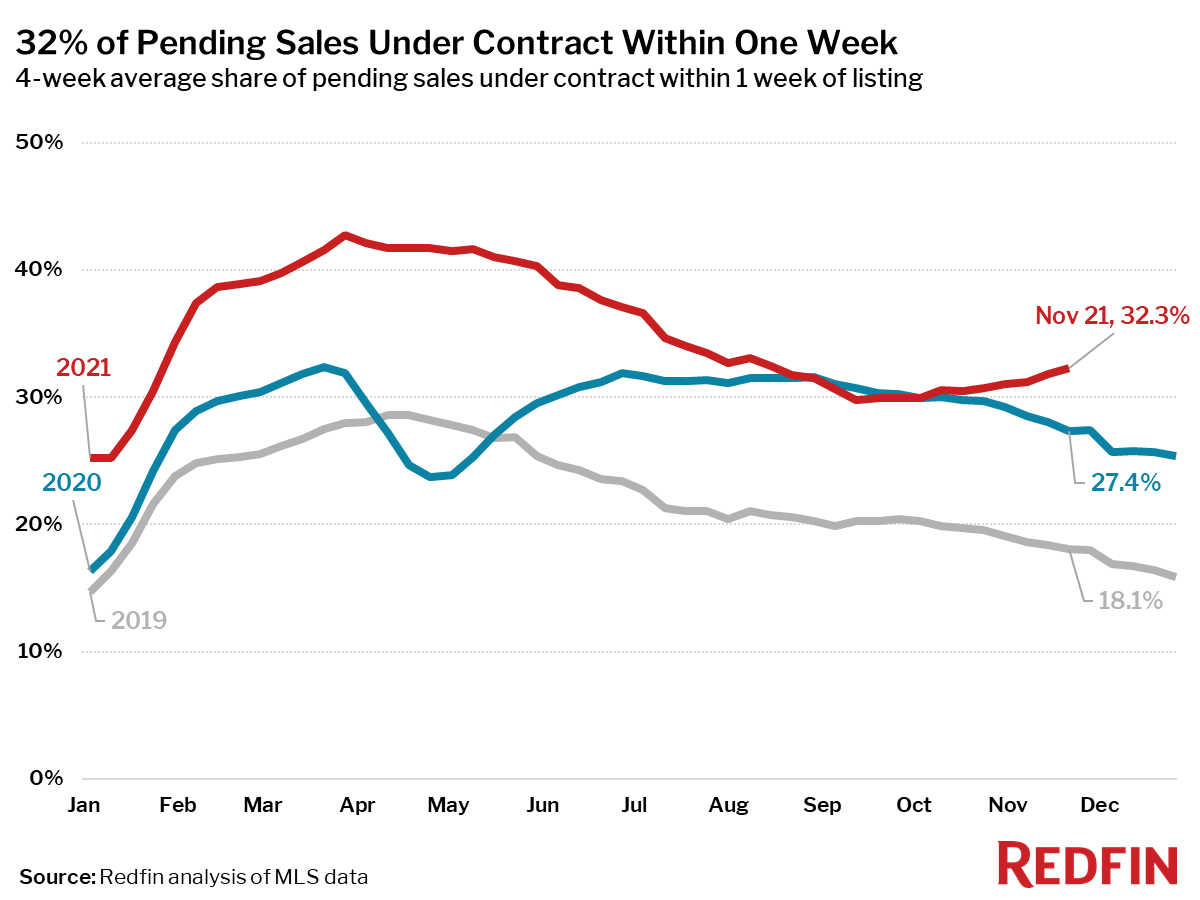
- 32% of homes that went under contract had an accepted offer within one week of hitting the market, up from 27% during the same period a year earlier and 18% in 2019. Since the four-week period ending September 12, the share of homes under contract within a week is up 2.5 percentage points. During the same time in 2019, the share fell 2.2 points.
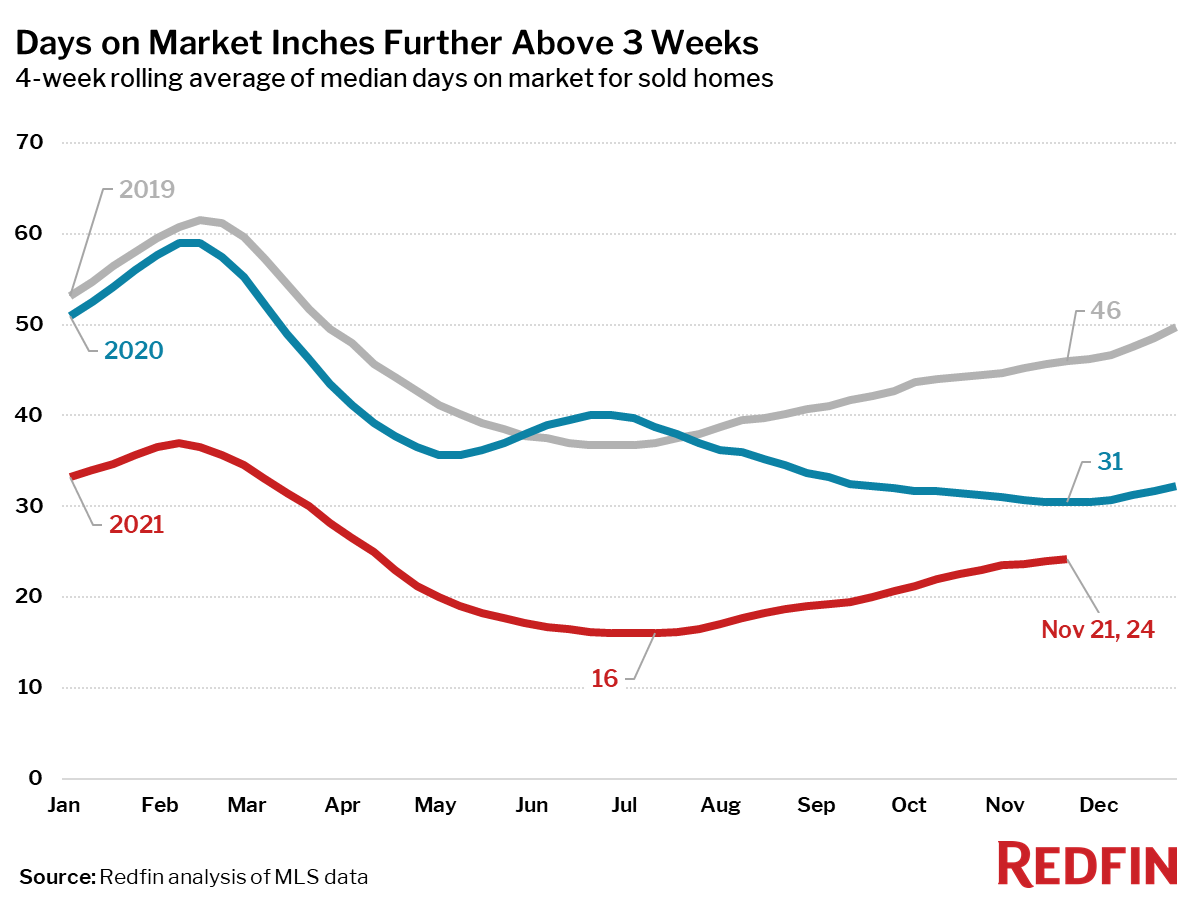
- Homes that sold were on the market for a median of 24 days, down from 31 days a year earlier and 46 days in 2019.
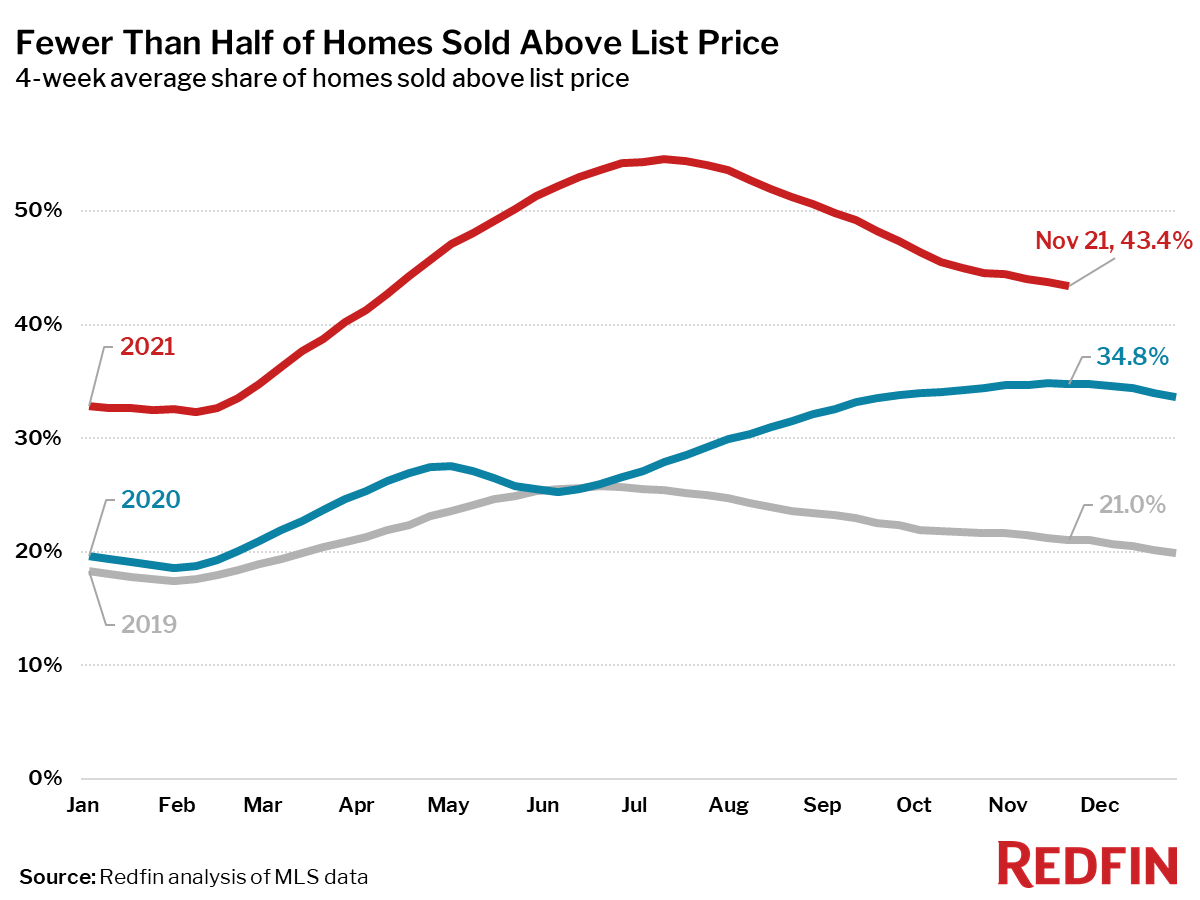
- 43% of homes sold above list price, up from 35% a year earlier and 21% in 2019.
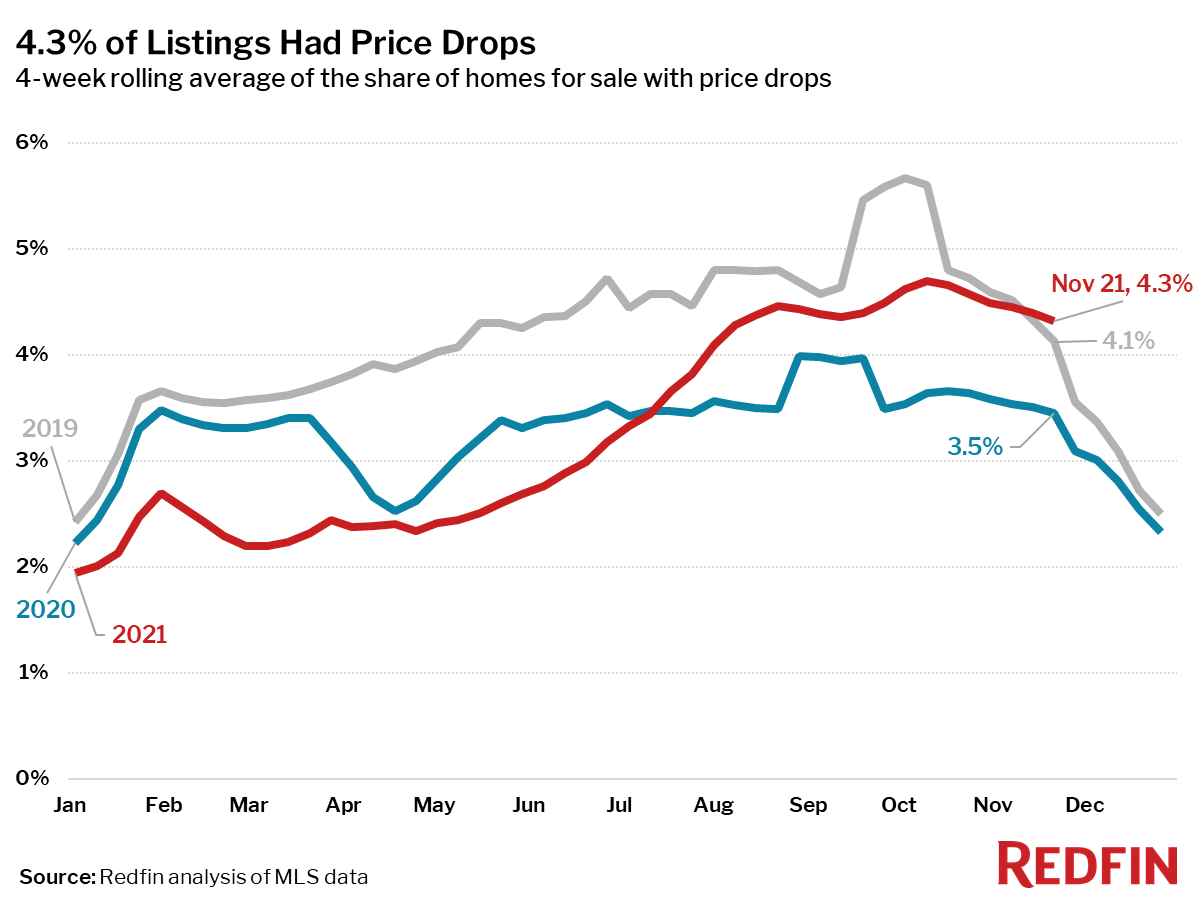
- On average, 4.3% of homes for sale each week had a price drop, up 0.8 percentage points from the same time in 2020 and up 0.2 points from this time in 2019.
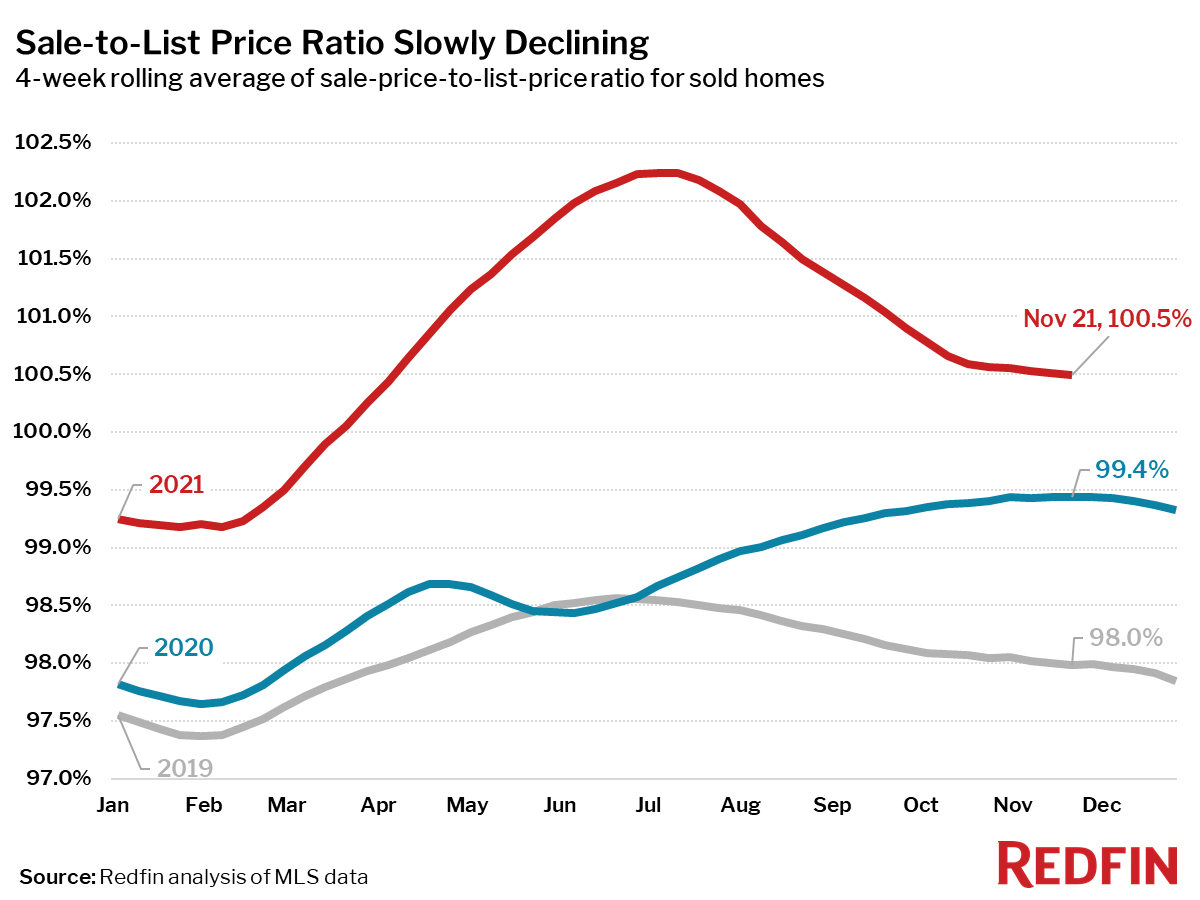
- The average sale-to-list price ratio, which measures how close homes are selling to their asking prices, has declined just 0.1 points from 100.6% to 100.5% over the past month. In other words, the average home sold for 0.5% above its asking price.
Other leading indicators of homebuying activity:
- Mortgage purchase applications increased 5% week over week (seasonally adjusted) during the week ending November 12. For the week ending November 18, 30-year mortgage rates rose back above 3% to 3.1%.
- Touring activity through November 21 fell about 1 percentage point behind 2019 relative to the first week of January according to home tour technology company ShowingTime.
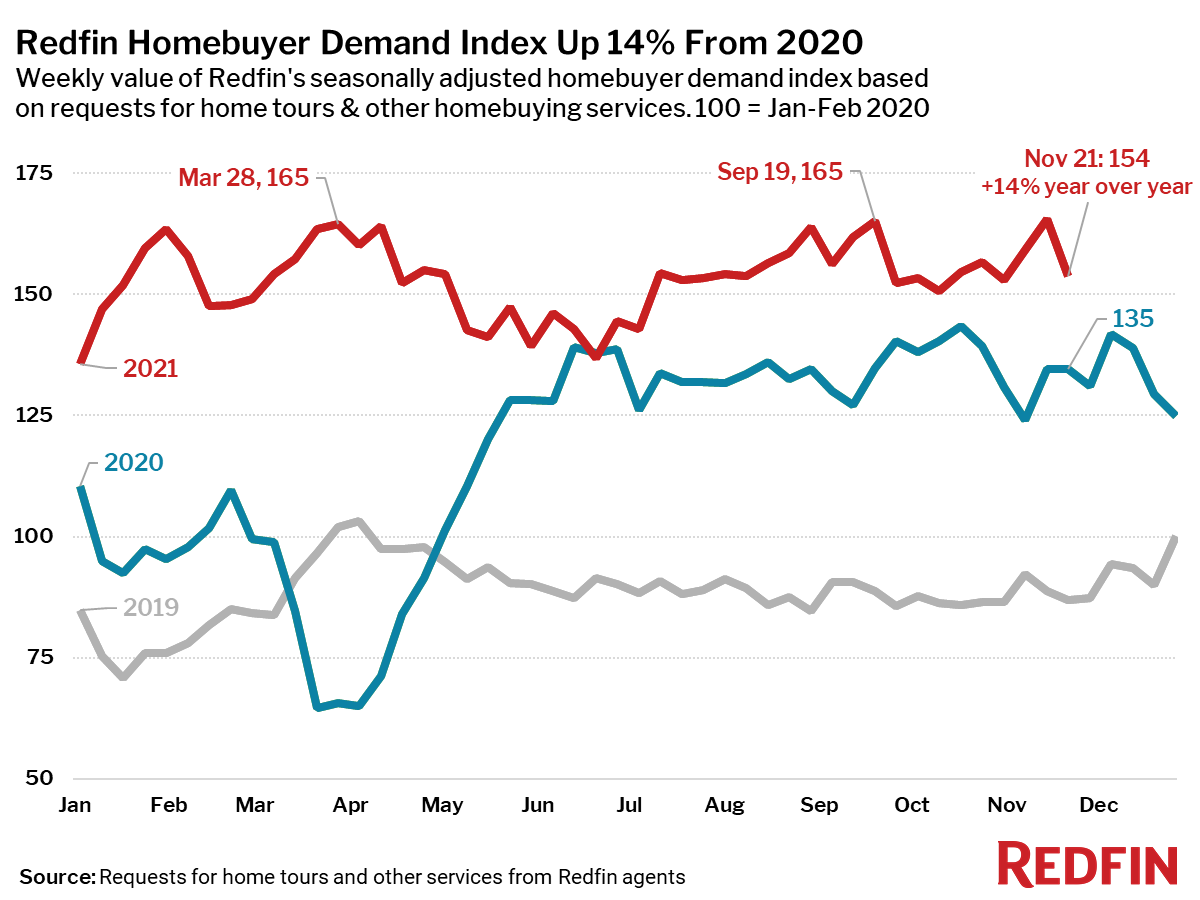
- The Redfin Homebuyer Demand Index fell 7% during the week ending November 21 but was up 14% from a year earlier. The seasonally adjusted Redfin Homebuyer Demand Index is a measure of requests for home tours and other home-buying services from Redfin agents.
Refer to our metrics definition page for explanations of all the metrics used in this report.
 United States
 Canada