
Highlights
- Manchester-Nashua, NH and Rochester, NY tied as the country’s hottest housing markets in September.
- The top 20 hottest markets are spread out across 12 states, with three metros in both Indiana and in Massachusetts.
- As prices begin to level off nationwide, affordability remains a key feature of September’s hottest markets with 14 markets below the national median listing price.
- There are no Western region markets on this month’s list again, for the fourth month in a row.
- The St. Louis, MO metro area saw the largest increase in its Hotness ranking among larger metros compared to last year, climbing the 101 spots to rank as the 97th hottest US market in September.
Manchester-Nashua, NH and Rochester, NY tied for the top spot on the hottest housing markets list in September. This is the 10th time that Manchester-Nashua has ranked number one in the last year, and the third time for Rochester. Manchester-Nashua has been in the top 2 hottest markets since March 2021, holding the top spot a total of 15 times. Rochester held the top spot for the first time in June 2020, and has been ranked number one a total of 6 times.
Realtor.com’s Market Hotness rankings take into account two aspects of the housing market: 1) market demand, as measured by views per property on Realtor.com, and 2) the pace of the market as measured by the number of days a listing remains active on Realtor.com.
Relatively Affordable Metros Sustain Demand
There are no West region markets on the list this month, a departure from the September 2016-2021 average of 7 Western hot markets. The popularity of Western markets tends to peak in the winter and wane in the warmer months, but these markets have not been absent from the September list altogether in the data’s history. Pricey Western markets have been replaced with more markets in the Northeast and Midwest, which account for 18 of the 20 hot markets.

Overall, 14 of September’s hottest markets had median listing prices below the national median. The average listing price for the 20 hottest markets ticked up from last month, reaching $364,000 in September, 14.8% lower than the national median. This month’s increase in average hot market listing price is due to the entrance of the Boston metro to the hot markets list. The median listing price in the number 18 ranked Boston metro in September was $742,000, skewing the list’s average price significantly higher. The Northeast in general, and the Boston metro specifically, are hotbeds of activity, as discussed in the 2022 Hottest Zip Codes report.
Affordable Midwest metros held 8 spots on this month’s list, with an average listing price of $269,000, 37.0% lower than the national median. Indiana boasted 3 markets on the list again in September, as did Massachusetts. Indiana offers buyers affordability with Fort Wayne, Elkhart-Goshen and Lafayette-West Lafayette all priced below the national median in September. The least expensive market on the list was Rockford, IL where the median home price was $187,000 in September.
The Northeast held 10 spots on September’s list, including several markets that include zips from the 2022 Hottest Zip Codes list. The Northeast hottest markets included three Massachusetts locales: Boston, Springfield and Worcester. The Manchester-Nashua, Concord, Springfield and Worcester metro areas all surround the Boston metro area, emphasizing the demand to be near this Northeast hub. The presence of Boston on the list suggests that buyers are exploring all options to be favorably located for being back in the office occasionally or often. The two Southern region markets on the list were Kingsport-Bristol, TN and Johnson City, TN.
The states featured in our top 20 list this month are: Connecticut, Illinois, Indiana, Kansas, Massachusetts, Maine, New York, New Hampshire, Ohio, Tennessee, Vermont and Wisconsin.
Hot Markets See High Demand and Price Growth
Our Hottest Housing Markets, by design, are the areas where homes sell fastest and have lots of potential buyers checking out each listing, suggesting relatively favorable conditions for sellers. As a group, Realtor.com’s 20 Hottest Housing Markets received 1.6 to 3.1 times the number of views per home for sale compared to the national rate. These markets are seeing homes-for-sale move up to 25 days more quickly than the typical property in the United States. Because homes in the hottest markets move fast, shoppers in these areas should be aware of conditions and have their finances in order, including a mortgage pre-approval, so that they can submit an offer quickly if they find a home that is a good fit.
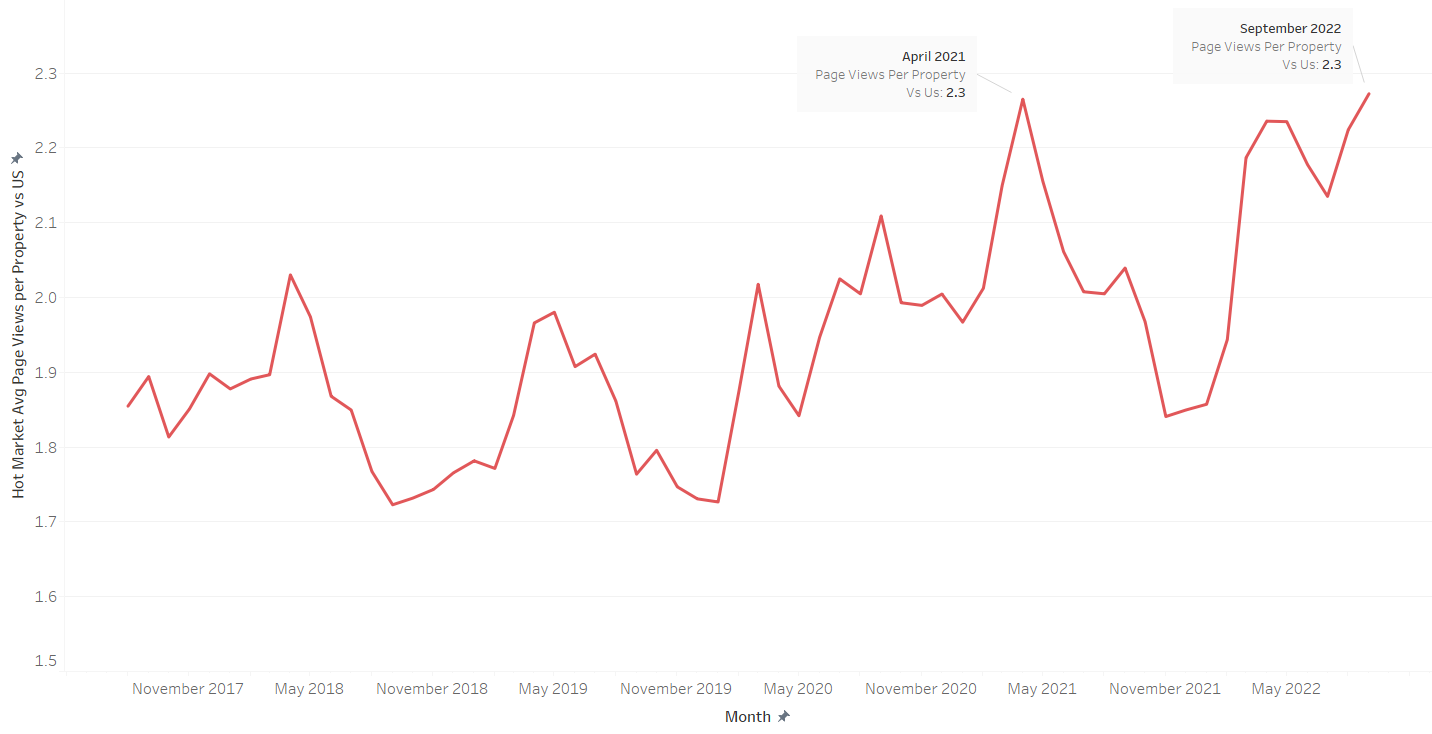
The hottest markets saw median listing viewership an average of 2.3 times higher than was typical in the US in September, the highest level since April 2021, emphasizing the sustained relative popularity of these hot markets. While nationwide housing conditions have changed dramatically from a frenzy in April 2021 to a more balanced market in September 2022, homes in the hottest markets attract a greater than typical number of home shoppers, with a larger difference between the typical market and the hottest market than was common in the years before the pandemic, as shown in the figure below. The key takeaway for buyers and sellers here is that while national real estate trends are an important context, the temperature of your local market could be quite different.
The median national home price for active listings fell again in September to $427,000, up 13.9% year-on-year. The majority of September’s hottest markets are relatively affordable Midwest and Northeast markets that fall below the national median price, despite seeing price growth that outpaces the national rate. On average, these hot markets have seen prices increase by 17.7% year-over-year, outpacing the national rate of 13.9%, as well as historical monthly hot market average price growth. Since the fall of 2020, the hottest markets tended to be markets that saw lower price growth than the US average. However, in September, this trend reversed as the hottest markets outpaced US price growth, though remaining lower priced than the US average. This suggests that demand for affordability is driving relatively high price growth in otherwise affordable locales, a trend consistent with greater interstate home shopping observed in the Realtor.com Q2-2022 Cross Market Demand Report.

September 2022 – Top 20 Hottest Housing Markets
| Hottest Metros | Hotness Rank | Hotness Rank YoY | Views per Property vs US | Median Days On Market | Days on Market YoY | Median Listing Price If Active Within Period |
| Manchester-Nashua, N.H. | 1 | 0 | 2.8 | 30 | 10 | $487,400 |
| Rochester, N.Y. | 1 | -1 | 2.5 | 25 | 4 | $222,500 |
| Fort Wayne, Ind. | 3 | 0 | 2.2 | 25 | 1 | $299,900 |
| La Crosse-Onalaska, Wis.-Minn. | 4 | -14 | 2.2 | 30 | 0 | $350,925 |
| Columbus, Ohio | 5 | -1 | 2.3 | 32 | 8 | $337,400 |
| Topeka, Kan. | 5 | -1 | 2.1 | 29 | 6 | $229,900 |
| Burlington-South Burlington, Vt. | 7 | -82 | 2.3 | 36 | -8 | $467,000 |
| Lafayette-West Lafayette, Ind. | 8 | 3 | 2.1 | 33 | 10 | $291,250 |
| Worcester, Mass.-Conn. | 9 | -5 | 1.9 | 33 | 4 | $439,450 |
| Springfield, Mass. | 10 | -2 | 2.2 | 37 | 7 | $350,000 |
| Portland-South Portland, Maine | 11 | -4 | 2.9 | 39 | 7 | $540,125 |
| Hartford-West Hartford-East Hartford, Conn. | 12 | -32 | 2.8 | 39 | 1 | $372,400 |
| New Haven-Milford, Conn. | 13 | -35 | 2.3 | 39 | 1 | $352,450 |
| Elkhart-Goshen, Ind. | 14 | 6 | 1.7 | 31 | 7 | $257,425 |
| Kingsport-Bristol-Bristol, Tenn.-Va. | 15 | -23 | 2.7 | 40 | 2 | $290,000 |
| Rockford, Ill. | 16 | -33 | 1.9 | 39 | 6 | $187,450 |
| Akron, Ohio | 17 | -36 | 1.7 | 37 | -1 | $197,000 |
| Boston-Cambridge-Newton, Mass.-N.H. | 18 | -9 | 1.6 | 35 | 6 | $742,000 |
| Johnson City, Tenn. | 19 | 6 | 3.1 | 42 | 12 | 379,350 |
| Concord, N.H. | 20 | -5 | 2.3 | 42 | 7 | 480,950 |
Manchester-Nashua, NH Shares Crown with Rochester, NY
The Manchester-Nashua, NH and Rochester, NY metros were tied this month as the country’s hottest markets. Manchester-Nashua saw slightly higher demand than Rochester, but the pace of sale in Rochester was quicker than in Manchester-Nashua. These two markets are appealing due to the value they offer buyers. Rochester is overall extremely affordable relative to the rest of the country, while Manchester-Nashua offers an affordable alternative specifically to the expensive Boston metropolitan area.
The Manchester-Nashua, NH metro area has held the title of hottest market a total of 15 times. Homes in Manchester-Nashua were selling in under 30 days in September— 10 days slower than last year, but almost 3 weeks faster than was typical in the rest of the country. Properties in the metro drew in 2.8 times as many views per property as the typical home around the United States. The median listing price of homes in the Manchester-Nashua area was $487,000 in September, up 17.1% year over year, faster than the 13.9% advance in the national median listing price in the same period. The typical home listing in Manchester-Nashua is priced 14.1% above the national median price of $427,000. Manchester-Nashua offers an affordable alternative to both nearby Boston, MA where the median listing price reached $742,000 in September. Home prices grew year-over-year in Manchester-Nashua due to both general price growth and a shift in home size. The median home size in Manchester-Nashua increased by 7.2% compared to September 2021. Controlling for home size, the median listing price per square foot increased by 12.4% compared to the previous year.
The Rochester, NY metro area has held the top spot on the hottest markets list 6 times. Homes in this metro sold in just 25 days in September, half the time of the typical US home. Homes in this metro also attracted 2.5 times the number of views as the typical US property. The median home price in Rochester was $223,000 in September, more than $100,000 lower than the US median, likely feeding the area’s popularity. Unlike in Manchester-Nashua, Rochester has only seen prices grow about 6.0% compared to last year, lagging the US considerably.
Most Improved Large Markets
Larger urban markets stayed consistent this month, with the largest 40 markets across the country getting just 1 rank hotter, on average, since September 2021.
In line with overall hottest market trends, four of the top five most-improved large housing markets were in the Midwest: St. Louis, MO (+101 spots), Chicago, IL (+100 spots), Milwaukee, WI (+79 spots), and Indianapolis, IN (+66 spots). These markets offered highly sought-after affordability with listing prices 1.7% to 35.6% below the national median of $427,000. The third ranked most improved market was Atlanta, GA (+80 spots).
The St. Louis, MO housing market saw the fastest year-over-year hotness growth in the metro’s data history, earning it the position of fastest-rising large market in September. In the second quarter of 2022, this metro received the most (29.2%) out-of-metro attention from viewers in the Chicago, IL metro area according to Realtor.com Cross-Market Demand data. In September, the St. Louis area rose 101 spots in hotness rank compared to last year. The metro area clocked in as the 97th hottest metro in the US, the highest September ranking in the data history. Homes in St. Louis typically spent 45 days on the market in September, 5 days fewer than the typical US home. On the demand side, properties in the metro garnered 24.0% more viewers than the typical US property.
As affordable Midwest large markets continued to gain traction in September, Atlanta made its way to the third most improved large market as the highest priced most improved market. The median listing price in Atlanta was $419,000 in September, still affordable at about $8,000 less than the US median. Though Atlanta only attracted about 78% the number of viewers compared to the typical US property, homes spent about a week less time on market, thereby driving its hotness ranking. Atlanta drew out-of-metro viewership from the New York City, Washington DC and Miami areas in Q2 2022.
On the supply side, the five most-improved large markets saw inventory move roughly two days slower than last year, holding pace well relative to the US. In comparison, the largest 40 markets overall saw properties spend roughly a week more time on the market than last year, on average. The typical property spent 41 days on the market in the most-improved metros, 9 days less than the national norm.
Markets Seeing the Largest Jump in Rankings (September 2022)
| Metro | Hotness Rank | Hotness Rank YoY | Views per Property vs US | Median Days On Market | Days on Market YoY | Median Days on Market vs US |
| St. Louis, Mo.-Ill. | 97 | -101 | 1.24 | 45 | 2 | -5 |
| Chicago-Naperville-Elgin, Ill.-Ind.-Wis. | 127 | -100 | 0.88 | 41 | 2 | -9 |
| Atlanta-Sandy Springs-Roswell, Ga. | 169 | -80 | 0.78 | 43 | -1 | -7 |
| Milwaukee-Waukesha-West Allis, Wis. | 33 | -79 | 1.54 | 40 | 3 | -10 |
| Indianapolis-Carmel-Anderson, Ind. | 65 | -66 | 1.15 | 40 | 3 | -10 |
Note: With the release of its September 2022 housing trends report, Realtor.com® incorporated a new and improved methodology for capturing and reporting housing inventory trends and metrics. The new methodology updates and improves the calculation of time on market and improves handling of duplicate listings. Most areas across the country will see minor changes with a smaller handful of areas seeing larger updates. As a result of these changes, the data released since October 2022 will not be directly comparable with previous data releases (files downloaded before October 2022) and Realtor.com® economics blog posts. However, future data releases, including historical data, will consistently apply the new methodology. Demand is now measured according to views per property instead of unique viewers.