The Wall Street Journal/Realtor.com Emerging Housing Markets Index
Introduction
As we move into Fall, households and investors continue to navigate a resetting housing market amid broader economic uncertainty. While recent indicators remain favorable, including a fresh long-term low unemployment rate and record high levels of home equity, these positives are overshadowed by financial trends that question the economy’s resilience. The sharp climb in mortgage rates, which began early in 2022 and continued into the spring, took a small breather in late summer before resuming in earnest in recent weeks. Combined with rising home prices, higher mortgage rates have significantly increased the cost of a monthly mortgage payment, up more than 70% from one year ago, sapping the purchasing power of shoppers who don’t pay with cash.
The impact of higher rates is dampening home purchase sentiment and shaping homebuyer preferences, making affordability, which was already a top consideration as noted in our Summer, Spring, and Winter 2022 releases, even more important. However, even as the number of homes for sale increases, a home that fits the budget has become harder to find, especially for first-time home buyers who lack home equity to rely on. This has prompted shoppers to significantly broaden their search horizons, with interstate home shopping continuing to make up a majority of shopping.

Fall 2022 Top 20 Emerging Housing Markets
Against a backdrop of affordability-driven relocation, the Wall Street Journal/Realtor.com Emerging Housing Markets Index highlights housing markets that offer shoppers healthy local economies, vibrant local business communities, and the kind of lifestyle features that will continue to draw others in. The index identifies markets that we believe are well-positioned for both homeowners and investors who are looking to make a purchase to consider.
We reviewed data for the largest 300 metropolitan areas in the United States. The fall 2022 ranking surfaced the following top areas:
| Rank | Metro | Population | Unemployment Rate (%) | Median Home Listing Price September 2022
|
| 1 | Johnson City, TN | 204,540 | 3.4% | $379,000 |
| 2 | Visalia-Porterville, CA | 468,680 | 7.4% | $400,000 |
| 3 | Elkhart-Goshen, IN | 206,161 | 2.2% | $257,000 |
| 4 | North Port-Sarasota-Bradenton, FL | 854,684 | 2.4% | $548,000 |
| 5 | Fort Wayne, IN | 416,565 | 2.7% | $300,000 |
| 6 | Lafayette-West Lafayette, IN | 233,278 | 2.6% | $291,000 |
| 7 | Columbia, SC | 847,397 | 2.9% | $309,000 |
| 8 | Columbia, MO | 210,094 | 2.0% | $347,000 |
| 9 | Raleigh, NC | 1,420,376 | 3.0% | $463,000 |
| 10 | Yuma, AZ | 217,824 | 14.7% | $315,000 |
| 11 | Tampa-St. Petersburg-Clearwater, FL | 3,243,963 | 2.5% | $429,000 |
| 12 | Cape Coral-Fort Myers, FL | 790,767 | 2.5% | $465,000 |
| 13 | Nashville-Davidson–Murfreesboro–Franklin, TN | 1,961,232 | 2.7% | $529,000 |
| 14 | Colorado Springs, CO | 753,839 | 3.5% | $504,000 |
| 15 | Burlington, NC | 171,346 | 3.6% | $353,000 |
| 16 | Naples-Immokalee-Marco Island, FL | 392,973 | 2.4% | $777,000 |
| 17 | Fayetteville-Springdale-Rogers, AR-MO | 548,634 | 2.3% | $408,000 |
| 18 | Orlando-Kissimmee-Sanford, FL | 2,639,374 | 2.9% | $449,000 |
| 19 | Topeka, KS | 230,878 | 2.6% | $230,000 |
| 20 | Columbus, OH | 2,138,946 | 3.4% | $337,000 |
Amid Broad Cooling, Housing Activity Remains Robust
Nationwide, housing activity has slowed as buyers contend with higher housing costs. As a result, home shoppers are generally seeing more homes available for sale, longer times on market, and slower home price growth. That’s also reflected in the top markets.
In 6 of the top 20 markets, the number of homes for sale has more than doubled compared to this time last year, including in all of the Florida markets except for Naples-Immokalee-Marco Island, FL, where active listings remain just below double, as well as Raleigh, NC, Nashville-Davidson–Murfreesboro–Franklin, TN and Colorado Springs, CO. In the other markets, home listings were up by an average 40% except in Topeka, KS, where there were fewer homes for sale than at this time last year.
Even though all of the top emerging markets saw an increase in time on market ranging from 1 to 23 days, homes in 16 of the 20 sold faster than the national average (48 days). Notably, Midwestern markets were the fastest moving among this quarter’s list with Fort Wayne, IN (25 days), Topeka, KS (29 days), Elkhart-Goshen, IN (31 days), Nashville-Davidson–Murfreesboro–Franklin, TN (31 days), and Columbus, OH (32 days) each seeing time on market under 33 days.
Home prices continue to increase nationwide and in the top markets, with the median home list price continuing to grow by double digits. Among the top markets, only Colorado Springs, CO and Raleigh, NC saw single-digit price growth in the year ended in September 2022.

Larger Markets Offer a Hedge Against Economic Uncertainty
While small and mid-sized markets are well represented, the Fall 2022 Emerging Housing Markets skew larger. On average, the population among the top 20 is nearly 900,000 and five of the markets exceed 1 million residents, with Raleigh, NC the smallest of the bunch (1.4 million). This is larger than both the roughly 400,000 average in the Summer markets and 600,000 in the Spring.
Although workers today have a fair amount of flexibility in a jobs market where available jobs vastly outnumber job seekers, home shoppers who anticipate cooling in the labor market, which the Fed projections suggest is likely, could be attracted to larger areas with their more diverse job offerings, particularly if home-shopping households have multiple workers contributing to household incomes. Generally, home prices in larger metros tend to be higher, a reflection of the desirability of those markets, and these areas are no exception, but they are affordable relative to other large markets
Strong Local Economies are Preferred
The vast majority of metros that top the Emerging Housing Markets Index have vibrant local economies and few out-of-work job seekers, with 18 of the 20 markets registering below the 3.6% average unemployment rate in the third quarter. Typical wages were nearly even between top markets and all markets reviewed, nearing $1,120 per week, and in an inflationary environment, low-cost areas are preferred, with all but two areas registering less expensive than the national cost of living. Three markets, including number one Johnson City, TN, as well as Yuma, AZ, and Topeka, KS offer residents a 10% or greater savings on cost of living.

But Compensating Factors Considered
While the vast majority of markets that top the Emerging Housing Markets Index have vibrant local economies and low unemployment rates, two Western areas on the list– Yuma, AZ and Visalia-Porterville, CA–are notable exceptions. Both markets, like many others on this list, offer proximity to national parks, rivers, and beaches that enable residents to get outside and enjoy nature. And perhaps reflecting a return to leisure activities involving crowds, such as live sports, theater, and music, several university towns including Fayetteville-Springdale-Rogers, AR-MO, Lafayette-West Lafayette, IN, Colorado Springs, CO, Columbia, MO, and Columbia, SC, are included among Fall’s top markets.
Top Areas Attract Outsiders Who Boost Real Estate Demand
Despite offices reopening, employees still have considerable flexibility on where they can work. Combine this with persistent inflation, and households have both means and motive to pursue a move to a lower-cost area–in effect creating their own personal inflation-fighting plan. These affordable emerging markets saw population grow 0.8% on average and their residents are relatively mobile, with roughly 16.7% moving in the last year compared to 15.4% among all markets reviewed. Perhaps most importantly for the local housing markets, these areas have seen an increase in home shoppers from elsewhere, with nearly 7-in-10 (69.5%) viewers checking out home listings from another market, an increase of 7.5 percentage points compared to the year prior.

City Spotlight: Johnson City, TN
Situated in the northeastern corner of Tennessee near Virginia and North Carolina, Johnson City attracts workers, families, and retirees alike for its vibrant economy and extensive outdoor offerings. This community of just over 200,000, has an unemployment rate just below the national average. Workers who do not bring their jobs with them will find options from major local employers such as East Tennessee State University, Johnson City Medical Center, and Ballad Health.
The in-demand housing market in Johnson City offers buyers affordability with a list price of just under $380,000, well below the September national median home list price which exceeds $425,000. Although homes still sell quickly, the area mirrors national trends with a slowing time on market and growing number of options for shoppers.
Johnson City continues to attract a large share of out-of-state home shoppers, with more than 4 of every 5 home shoppers (81.8%) looking from somewhere else. Out-of-market shoppers tend to come from one of two sources: high-cost metros or more expensive Tennessee cities. Many are from major east coast metros like New York, Washington DC, Atlanta, or Charlotte where the median home list price in each area exceeds $400,000. Interest may also stem from a lack of income tax in Tennessee, alongside its housing affordability. Still, many shoppers also hail from nearby communities such as Kingsport-Bristol, Nashville, or Knoxville in Tennessee, whose shoppers aren’t relocating for a tax advantage, or even Asheville, North Carolina, which is just an hour south.
In addition to favorable economic and housing conditions, Johnson City offers easy access to the Appalachian Trail and other hiking and biking opportunities on rails-to-trails projects like the Tweetsie Trail or more adventurous mountain terrain. With rivers and lakes nearby, those who prefer rafting, kayaking, or fishing will also feel at home.
Johnson City, TN Housing Highlights
| Realtor.com – Johnson City, TN: September 2022 Inventory Metrics | ||
| YoY % Change | ||
| Median List Price | $ 379,000 | 26.5% |
| Active Listings | 283 | 13.9% |
| Days on Market | 42 | 37.7% |
| New Listings | 224 | -28.7% |
Housing Demand From Elsewhere Drives Johnson City, TN
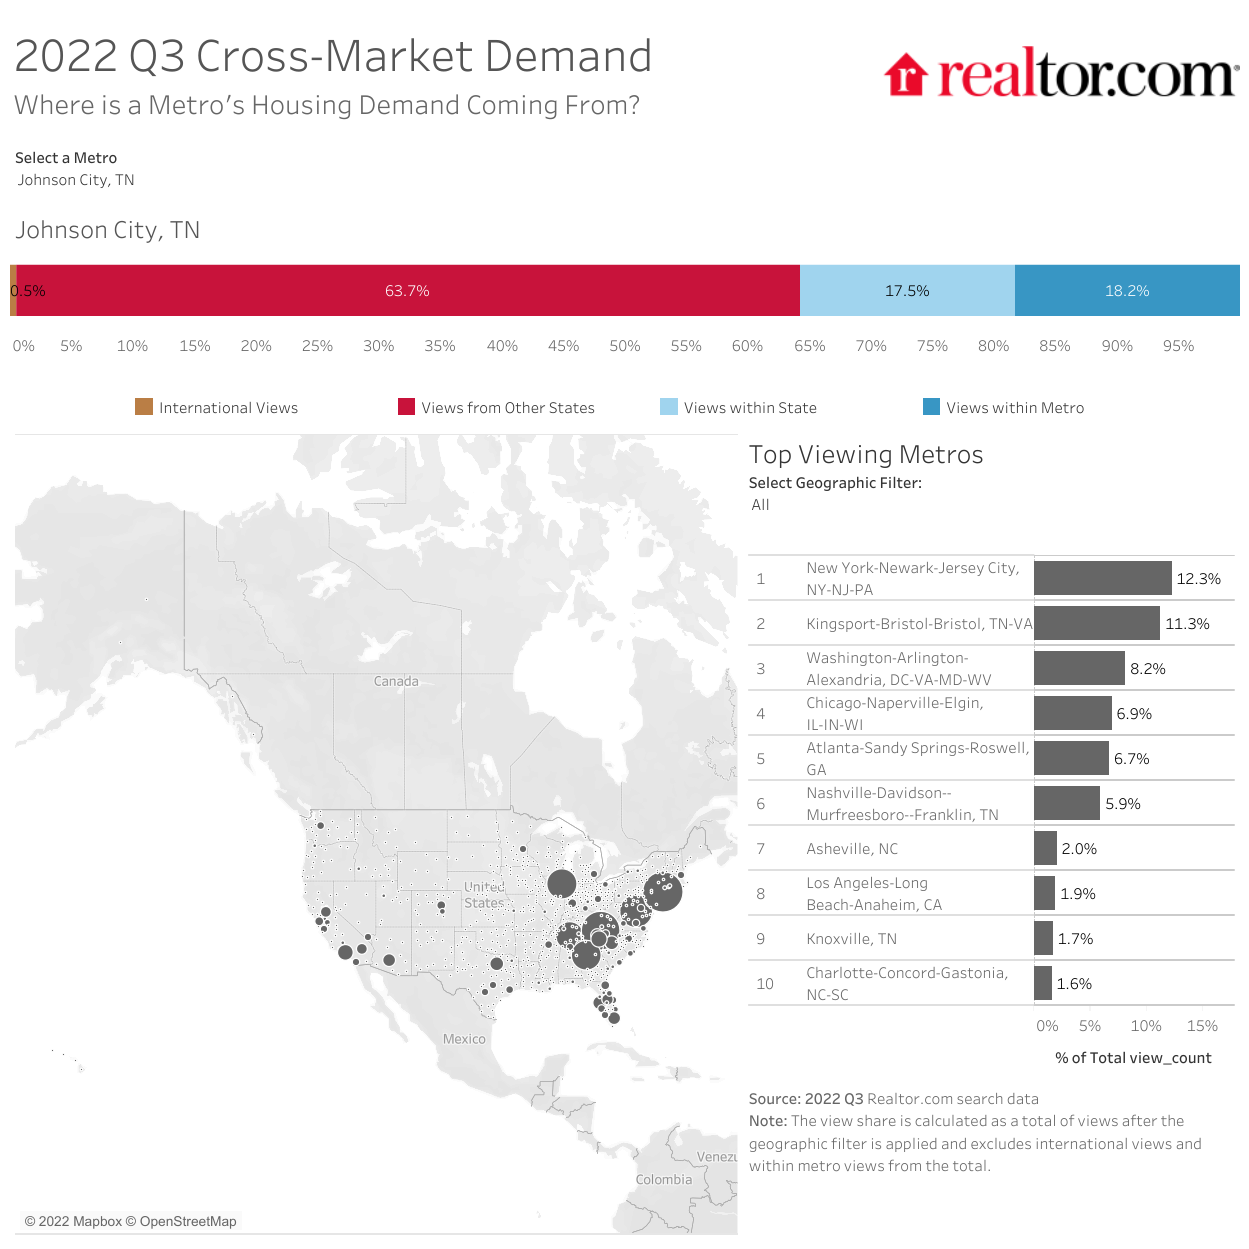
Who’s in – Who’s out? And Why?
Returning Markets
There are many familiar places on the list of the top 20 emerging markets: 9 members of the Summer 2022 list, most notably number 1, Johnson City, TN, and all of the Fall top 5, were also on the Summer list in July. The two highest-ranked markets from the second quarter of 2022 fell a few spots but all remained in the top 20, while the number 3 ranked spring metro made its way to number 1. Among the markets that have remained on our list are the ever-popular Raleigh, NC and Burlington, NC, the coastal North Port-Sarasota-Bradenton, FL, and various small- to mid-sized cities that offer affordable housing and low costs of living.
| Market | Fall Rank | Summer Rank | Rank Change |
| Johnson City, TN | 1 | 3 | 2 spots higher |
| Visalia-Porterville, CA | 2 | 10 | 8 spots lower |
| Elkhart-Goshen, IN | 3 | 1 | 2 spots lower |
| North Port-Sarasota-Bradenton, FL | 4 | 8 | 4 spots higher |
| Fort Wayne, IN | 5 | 4 | 1 spot lower |
| Raleigh, NC | 9 | 6 | 3 spots lower |
| Colorado Springs, CO | 14 | 20 | 6 spots higher |
| Burlington, NC | 15 | 2 | 13 spots lower |
| Topeka, KS | 19 | 9 | 10 spots lower |
Markets Falling Out of the Top 20
Of the 11 markets that did not remain on the list from the Summer into the Fall, 7 tumbled a bit but remained in the top 50. Even the two biggest movers, Rapid City, SD and Eureka-Arcata-Fortuna, CA, which fell 59 and 79 spots respectively, remained within the top third of areas studied. The markets that departed the top 20 in our index are mostly high-priced West region markets, plus the Southern markets of Huntsville, AL, Durham-Chapel Hill, NC and Elizabethtown-Fort Knox, KY. As economic conditions have changed since earlier in the year, with mortgage rates rising sharply, these more expensive markets have fallen out of favor.
| Market | Fall Rank | Summer Rank | Rank Change |
| Huntsville, AL | 28 | 15 | 13 spots lower |
| Boulder, CO | 33 | 14 | 19 spots lower |
| Billings, MT | 39 | 5 | 34 spots lower |
| Durham-Chapel Hill, NC | 40 | 12 | 28 spots lower |
| Santa Cruz-Watsonville, CA | 41 | 13 | 28 spots lower |
| Jefferson City, MO | 44 | 18 | 26 spots lower |
| Fort Collins, CO | 47 | 11 | 36 spots lower |
| Elizabethtown-Fort Knox, KY | 58 | 19 | 39 spots lower |
| Vallejo-Fairfield, CA | 60 | 16 | 44 spots lower |
| Rapid City, SD | 66 | 7 | 59 spots lower |
| Eureka-Arcata-Fortuna, CA | 96 | 17 | 79 spots lower |
New Markets
Taking the places of the 11 descended markets are four Florida metros, four relatively affordable Midwestern towns, the Southern hotspots Nashville, TN and Columbia, SC, and the one Western market that climbed into the top 20, Yuma, AZ. Most of the markets ascended from within the top 50, but Cape Coral-Fort Myers, FL, Fayetteville-Springdale-Rogers, AR-MO, and Orlando-Kissimmee-Sanford, FL made larger jumps from the Summer rankings to land among the top of our Fall list. Much like the markets that stayed in the top 20, those that joined it tend to be more affordable. An interesting development is the return of four Florida markets, rounding out a total of five Florida markets in the top 20. Of note, the vast majority of data gathered for this Fall version of the rankings has a reference period before Hurricane Ian made landfall.
| Market | Fall Rank | Summer Rank | Rank Change |
| Lafayette-West Lafayette, IN | 6 | 24 | 18 spots higher |
| Columbia, SC | 7 | 39 | 32 spots higher |
| Columbia, MO | 8 | 38 | 30 spots higher |
| Yuma, AZ | 10 | 22 | 12 spots higher |
| Tampa-St. Petersburg-Clearwater, FL | 11 | 33 | 22 spots higher |
| Cape Coral-Fort Myers, FL | 12 | 84 | 72 spots higher |
| Nashville-Davidson–Murfreesboro–Franklin, TN | 13 | 46 | 33 spots higher |
| Naples-Immokalee-Marco Island, FL | 16 | 35 | 19 spots higher |
| Fayetteville-Springdale-Rogers, AR-MO | 17 | 60 | 43 spots higher |
| Orlando-Kissimmee-Sanford, FL | 18 | 72 | 54 spots higher |
| Columbus, OH | 20 | 47 | 27 spots higher |
Methodology
The ranking evaluates the 300 most populous core-based statistical areas, as measured by the U.S. Census Bureau, and defined by March 2020 delineation standards for eight indicators across two broad categories: real estate market (50%) and economic health and quality of life (50%). Each market is ranked on a scale of 0 to 100 according to the category indicators, and the overall index is based on the weighted sum of these rankings. The real estate market category indicators are: real estate demand (16.6%), based on average pageviews per property; real estate supply (16.6%), based on median days on market for real estate listings, median listing price trend (16.6%). The economic and quality of life category indicators are: unemployment (6.25%); wages (6.251%); regional price parities (6.25%); the share of foreign born (6.25%); small businesses (6.25%); amenities (6.25%), measured as per capita “everyday splurge” stores in an area; commute (6.25%); and estimated effective real estate taxes (6.25%).
Subscribe to our mailing list to receive monthly updates and notifications on the latest data and research.