

This post is also available in: 日本語 (Japanese)
Over the past few months, I’ve found myself continually being in the position of researching a new threat or campaign that results in the delivery of a cryptocurrency miner. As time progressed, I began asking myself it this was a coincidence, or part of a much larger trend. As such, I began to investigate how many cryptocurrency miners have historically been identified within Palo Alto Network’s WildFire platform. In doing so, I found a radical upward trend. The graph below represents how many new cryptocurrency mining malware samples have been identified over time. It should be noted that this dataset does not include JavaScript, or web-based, malicious mining activities, which continues to plague Internet users.
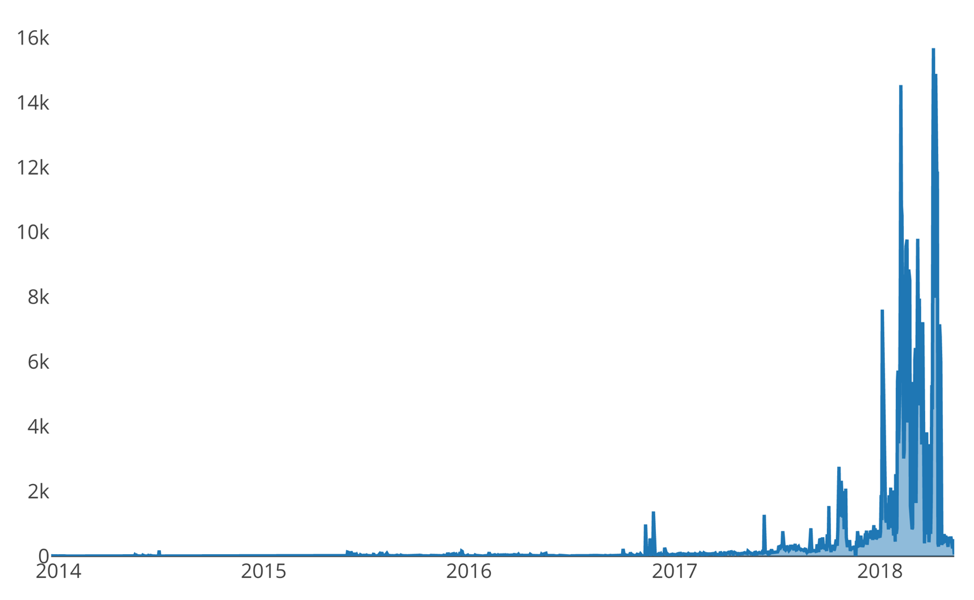
Figure 1 Instances where a new cryptominer sample was discovered over time
It should be noted that the graph above does not represent how often sessions we witnessed, but rather how often we identified a new cryptocurrency miner sample over time.
This realization of this trend was only the start, however, as I wished to analyze this entire dataset to answer some of the following questions:
- What cryptocurrencies are mined the most?
- How much money has historically been made by these actors?
Starting in roughly June 2017, Bitcoin and other top cryptocurrencies saw a dramatic rise in their value, as more and more people sought to invest, which ultimately drove up the price. Coincidentally, June 2017 is also when we began to witness the trend of a high uptick in cryptocurrency miners within the WildFire platform.
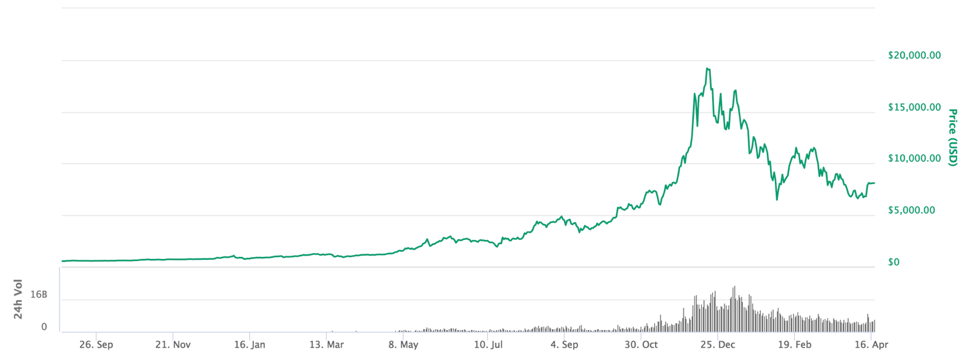
Figure 2 Timeline of price (USD) of Bitcoin (Image source: coinmarketcap.com)
This drastic increase in price climaxed in December 2017, where the price of Bitcoin rose to roughly $20,000. It has since corrected to roughly $8,000 at the time of this writing.
This blog represents and overview of my research to answer these questions, and the results I was able to discover.
General Statistics
To date, I have identified roughly 470,000 unique samples that ultimately deliver cryptocurrency miners. Using WildFire reports and associated PCAP data, I was able to analyze these samples to parse out various information, which included some or all of the following:
- Cryptocurrency targeted
- Wallet and email addresses used when connecting to mining pools
- Mining pool
This ultimately led me to collecting the following high-level information:
- 629,126 Samples
- 3,773 Emails used to connect with mining pools
- 2,995 mining pool URLs
- 2,341 Monero (XMR) wallets
- 981 Bitcoin (BTC) wallets
- 131 Electroneum (ETN) wallets
- 44 Ethereum (ETH) wallets
- 28 Litecoin (LTC) wallets
When looking at a breakdown of what cryptocurrencies are being targeted by mining malware, we see an incredible monopoly of the Monero cryptocurrency.
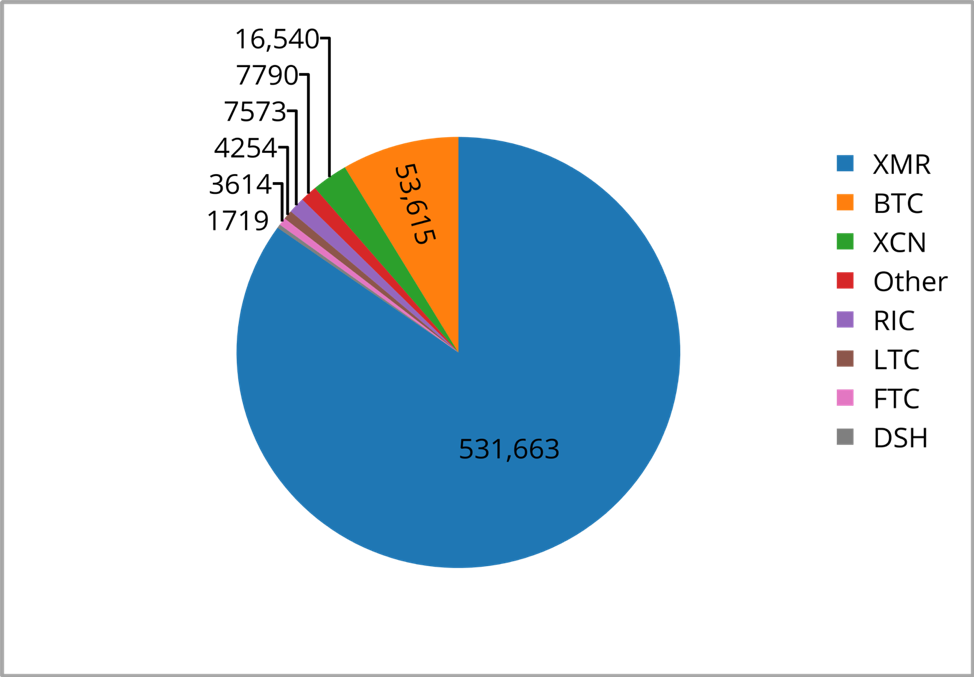
Figure 3 Breakdown of cryptocurrencies targeted by malicious miners
Monero Statistics
I extracted a total of 2,341 Monero wallets from the analyzed sample set. Unlike some other cryptocurrencies, it is impossible to query the Monero blockchain to extract a single wallet’s current balance without the owner’s password. This is by design: a result of how Monero was originally designed. As such, I needed to take a different methodology in order to determine how much money attackers were able to mine. Fortunately, in addition to the wallets, I was also able to determine which mining pools were used for various mining efforts. Looking at the top ten mining pools used by this malware, I determined that all but one allows for anonymous viewing of statistics based off of the wallet as an identifier. This anonymous viewing is intentional, as it allows users to anonymously connect and use various mining pools without inputting any personal identifiable information.
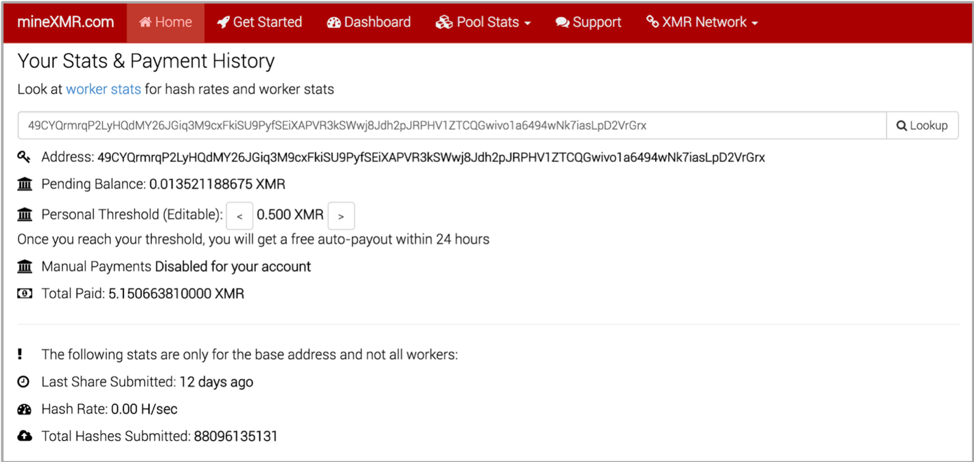
Figure 4 An example of anonymously querying a mining pool for information on a XMR wallet
By querying the top eight mining pools for all 2,341 Monero addresses, I was able to determine exactly how much Monero has been mined historically with a high degree of accuracy. By querying the mining pools themselves, instead of the blockchain, we’re able to say exactly how much has been mined without the fear of the data being polluted by payments to those wallets via other sources.
We used the following Monero pools for this research:
- moneropool.com
- minexmr.com
- monerohash.com
- monero.crypto-pool.fr
- xmrpool.eu
- c1d2.com
- dwarfpool.com
- nanopool.org
- supportxmr.com
By querying these addresses against these mining pools, we obtained the following statistics on how many Monero coins have been mined to date:
| Wallet | Mined Monero (XMR) |
| 496ePyKvPBRWEoQiqFEaL8frWuR9XuxNj98p69ZQRxmdZZHd5KVSS24bkYY93ASAxKPXn9XmnmeCxHz9NUdvvs8eE5BP24A | 88,448.53 |
| 49s5yfpFvEX8a2MBQDYxHpECwm3PVEYBq5E3i3wfZuZzbaRcgy3HVx6Qf2sjQHju5BcvF8VEohoW86VmP19nuz3YAcvLdUh | 79,576.81 |
| 44N9sqiizwFYX7ciXSdzycT7uBJpWLXv8Enief4ictiS5fdpmwwgAYFScjfB8nZRFVj2ZDzWdJdEVi5uMDvTrYbH3Mr4DYH | 56,344.09 |
| 42yJMfdGHQnJN5XEUHydTFFPzzuhUn7xEbL89V5Zkkfch7zxaZCJhyEfE8txXQmL6JY5Z1cXGtKeKbuNav7tarp7EoxsJtA | 32,885.95 |
| 42NCdZTvv3WDjVJTd4ny51SXQiKhUyprE9zrP5BsjqJu9aeWqwunHK7aHFR9ya8gJf2REyYwBMDxMjiAVPMBqsVHQqJe91y | 26,359.34 |
| 44cwDVn9cQsUqb9nroJm98am2CvT8aUoKKU3ctaKAtQSNoZWC9cFYzjXg1udRxT6XVDjX7DxThP7QYb9WwGCsNTT3XzPgUk | 23,300.37 |
| 46GGhVFZq8yKKVvqssxq9Qd1vyf9BWzWPUcgExPtCPqzgczXexskd93FJ6F9q3e7H46jTnGhXqdDu1pJcvD8PpPGRP2qRg5 | 22,519.95 |
| 42ychz53apvgs3EHMoeAyGQM3pq7EikTLTBu1RaBj8njgVfykF4v8HdPNyzAfDTDUGZfoLjMdh9Wa4u1Bm2t3f7aSFSwS4U | 21,389.34 |
| 46hoCjuFZBiTmqJ456NSnM3ynWt5KJYjVE8U2wUx2TVwFGmLMYNz2c4L3mQ9PRQEdVThcHWzU3eKKFwAtELczfJuLPnP9hd | 20,693.71 |
| 471c2w7dyMMe51cDTKSgqoHPpg6uW6A222W6ePHXeXhwEVqSbPunrCqCbRG3VUXXMZ47twKtzBEokarwADLYDqPaLefXQMm | 19,994.71 |
Total: 798613.33 XMR
One interesting note about the figure above is that the total Monero represented roughly 5% of all Monero in circulation at the time of writing. This if course doesn’t take into account web-based Monero miners, or Monero miners that we do not have visibility into. As such, we can assume that the actual percentage of Monero in circulation that was mined via malicious activity is actually higher.
Converting the figures above to USD with an exchange rate of $180 per Monero gives us the following figures:
| Wallet | Estimated Money Earned |
| 496ePyKvPBRWEoQiqFEaL8frWuR9XuxNj98p69ZQRxmdZZHd5KVSS24bkYY93ASAxKPXn9XmnmeCxHz9NUdvvs8eE5BP24A | $15,920,736.22 |
| 49s5yfpFvEX8a2MBQDYxHpECwm3PVEYBq5E3i3wfZuZzbaRcgy3HVx6Qf2sjQHju5BcvF8VEohoW86VmP19nuz3YAcvLdUh | $14,323,826.13 |
| 44N9sqiizwFYX7ciXSdzycT7uBJpWLXv8Enief4ictiS5fdpmwwgAYFScjfB8nZRFVj2ZDzWdJdEVi5uMDvTrYbH3Mr4DYH | $10,141,936.12 |
| 42yJMfdGHQnJN5XEUHydTFFPzzuhUn7xEbL89V5Zkkfch7zxaZCJhyEfE8txXQmL6JY5Z1cXGtKeKbuNav7tarp7EoxsJtA | $5,919,470.51 |
| 42NCdZTvv3WDjVJTd4ny51SXQiKhUyprE9zrP5BsjqJu9aeWqwunHK7aHFR9ya8gJf2REyYwBMDxMjiAVPMBqsVHQqJe91y | $4,744,680.66 |
| 44cwDVn9cQsUqb9nroJm98am2CvT8aUoKKU3ctaKAtQSNoZWC9cFYzjXg1udRxT6XVDjX7DxThP7QYb9WwGCsNTT3XzPgUk | $4,194,066.30 |
| 46GGhVFZq8yKKVvqssxq9Qd1vyf9BWzWPUcgExPtCPqzgczXexskd93FJ6F9q3e7H46jTnGhXqdDu1pJcvD8PpPGRP2qRg5 | $4,053,591.64 |
| 42ychz53apvgs3EHMoeAyGQM3pq7EikTLTBu1RaBj8njgVfykF4v8HdPNyzAfDTDUGZfoLjMdh9Wa4u1Bm2t3f7aSFSwS4U | $3,850,081.38 |
| 46hoCjuFZBiTmqJ456NSnM3ynWt5KJYjVE8U2wUx2TVwFGmLMYNz2c4L3mQ9PRQEdVThcHWzU3eKKFwAtELczfJuLPnP9hd | $3,724,868.25 |
| 471c2w7dyMMe51cDTKSgqoHPpg6uW6A222W6ePHXeXhwEVqSbPunrCqCbRG3VUXXMZ47twKtzBEokarwADLYDqPaLefXQMm | $3,599,048.14 |
Total Estimated Earned: $143,750,400.15
Looking at the overall distribution of wealth among the 2,341 wallets identified proves to provide interesting insight. Of the 2,341 wallets, only 1278 (55%) earned 0.01 XMR (~$2.20) or more. Nearly half of all the wallets identified have been unable to generate any meaningful amount of Monero, likely due to the malware being unsuccessful, or the attacker using a mining pool other than the ones queried.
Of the remaining 55% of the wallets, we see the following breakdown in wealth:
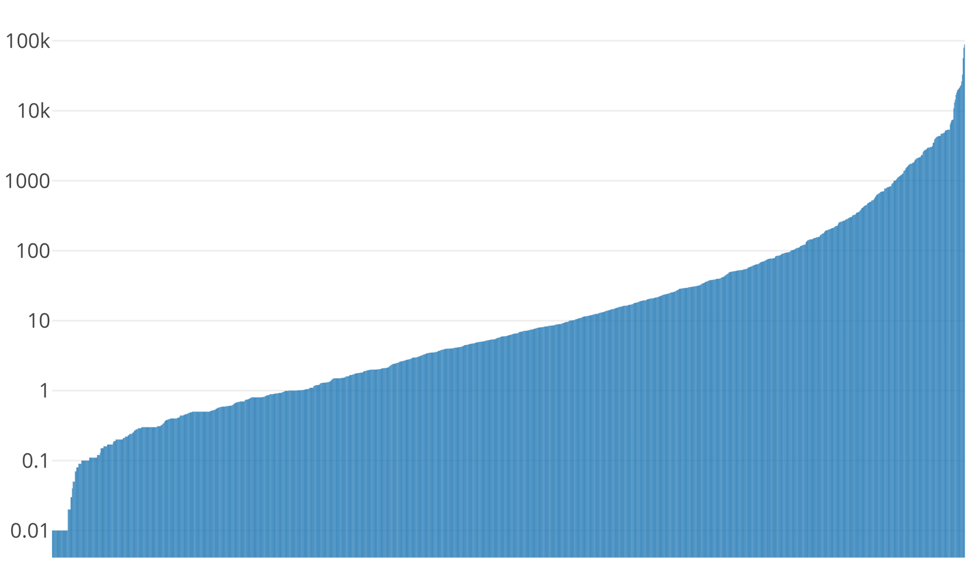
Figure 7 Distribution of Monero mined to wallets earning 0.01 XMR or greater via logarithmic scale
As we can see, only a small subset of the remaining 55% of wallets have earned a significant (100 XMR or greater) amount of coins. Only 244 wallets of these wallets have earned 100 XMR or greater. This represents 19% of the above chart, or 10% of all wallets identified.
Additionally, only 99 wallets have mined over 1,000 XMR, which represents 7.7% of the above chart, or 4% of all wallets identified.
Finally, 16 wallets have obtained over 10,000 XMR, which represents 1.25% of the above chart, or 0.68% of all wallets identified.
In addition to determining how much Monero/money has historically been mined, since we are querying the mining pools themselves, we can also perform a spot check against the total hashing power used by these attackers. Based on this spot check, we have the following figures:
| Wallet | Hashrate (H/s) |
| 45VVxJoFzrTGqgDNujawPB6xtLEo8MFbvL4eQVf6cyz7DQg1EdU1JADUyMVy4KspjRQfvgGefCCuxdKEMzWwwPnp4KwMy9b | 2,313,013.72 |
| 49e9B8HxzSbMWsNbMs72aVe78U9CCE2DAM5aDJYNeccWNvWiKfrPaGeewmTAjj6nt6Bqzob4zaRjLXfpW1WfRMnzEAQBHy7 | 1,248,794.28 |
| 45c2ShhBmuk6ukfdTLok59U86gWLXZo8kDJbpTm8uYT1U35mig1pUCbd6796AJviTPXetFrUo37XFGcEYU1k3tYe32o9qEr | 984,838.06 |
| 4AkDyZW4bkrWmrYWAC7CJFJhbRkLE4m1vKsS46CetPZM3TkyQ6FMgPXWbwaVe4vUMveKAzAiA4j8xgUi29TpKXpm42jtnPq | 865,655.00 |
| 48dDEWnbhC59HNNm2CHur859zmG4CgGkZNU67tXgLjr1gem4KCXf3e1GU37dXy8cs44Pw7s5wp9L4JQoYUyno8E14nSFGXx | 451,653.06 |
| 43SVizefGVNRcMkocYwPBEafoazcN3HgMWb2fjaLrxP4ew61sw3fNfCQkoSwReVE6cZjpRe1TYvf5aqrUPAUB72DAcdXanZ | 371,118.09 |
| 48j5us6QWvQUAk7E1GKC6mFMH52183TNrDqrYjXV7mMngVX9t1GuptEb35QwefNsPPhGLWEqxHrY7JCxeDzC6ub8MuwyAfq | 367,899.55 |
| 41xDYg86Zug9dwbJ3ysuyWMF7R6Un2Ko84TNfiCW7xghhbKZV6jh8Q7hJoncnLayLVDwpzbPQPi62bvPqe6jJouHAsGNkg2 | 321,845.00 |
| 496ePyKvPBRWEoQiqFEaL8frWuR9XuxNj98p69ZQRxmdZZHd5KVSS24bkYY93ASAxKPXn9XmnmeCxHz9NUdvvs8eE5BP24A | 310,660.00 |
| 425sBVwP8ip9kb85vNyEXkAdfh5CqBjjzir8cNTiVXHwf5PZ5XppFJhJempwxY8CuVHDUeFaAkzwF9ohx8J2nRMw9fkjaUZ | 297,920.00 |
Total Hashrate: 19,503,823.54 H/s
The total hashrate above represents roughly 2% of the global hashing power mining the Monero network. The total hashrate of roughly 19MH/s would result in approximately $30,443 per day based on today’s current exchange rates and network difficulty.
Similarly, the top three hashrates will mine approximately $2,737, $2,022 and $1,596 per day, respectively.
Looking at a couple of the miner’s hashrates historically shows some interesting visual representations of how this activity looks in the wild. In the graph below, we discover a consistent upward and downward trend that takes place once a day. It is not fully clear why this change occurs on a daily basis, but it is consistent in a number of other malicious cryptocurrency miners encountered. One hypothesis for why this activity may be occurring is that the malware may be configured to only operate at given times of the day, or when the user is not active on the system. Alternatively, perhaps the victims are concentrated in a specific geographical region, and this upward and downward flow is simply a result of users shutting off their machines in the evening hours. The wallet below has historically obtained roughly 1,000 XMR, or about $200,000 by the current exchange rates.
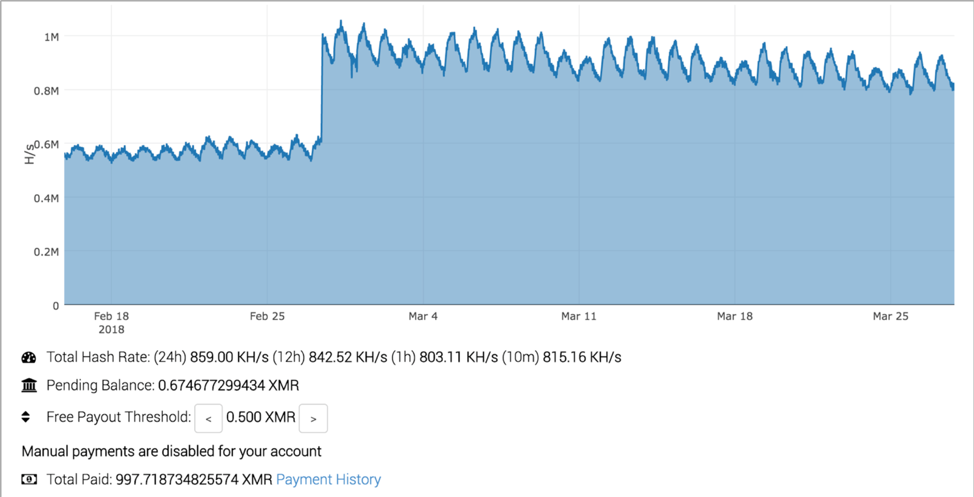
Figure 9 Example graph showing mining activity over time for a specific wallet address (2/3)
Looking at the top miner based on hashrate shows an interesting depiction:
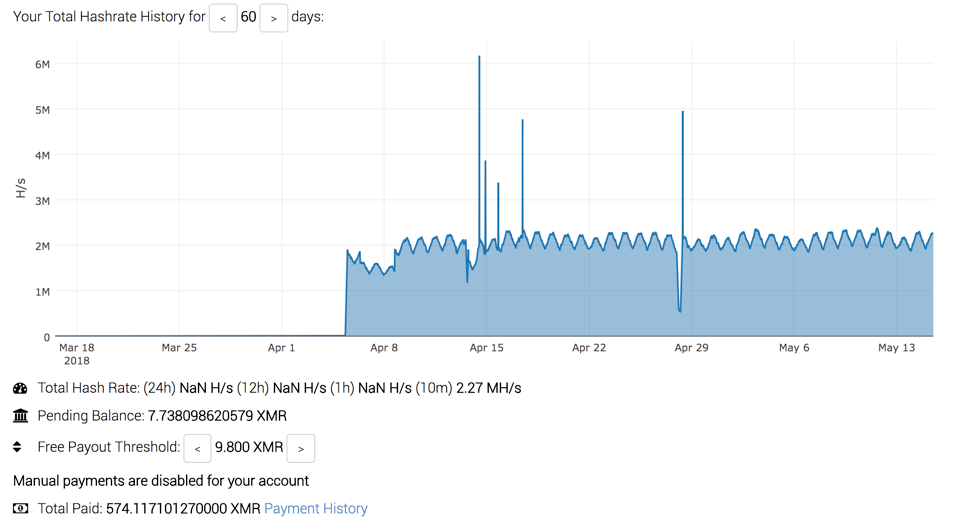
Figure 10 Example graph showing mining activity over time for a specific wallet address (2/3)
In addition to seeing the same wave pattern as the first example, we also notice that the activity for this miner is fairly recent, beginning in early April of this year. In less than 3 months, this particular actor has accumulated 575 XMR, or roughly $126,500 based on today’s exchange rates.
In addition to the upward and downward flow, we also encounter wallets that have a much more consistent mining capacity. This is very similar to activity you might encounter by a benign cryptocurrency miner, which makes it difficult to easily identify. The wallet below has historically obtained roughly 2,000 XMR, or about $400,000 by the current exchange rates.
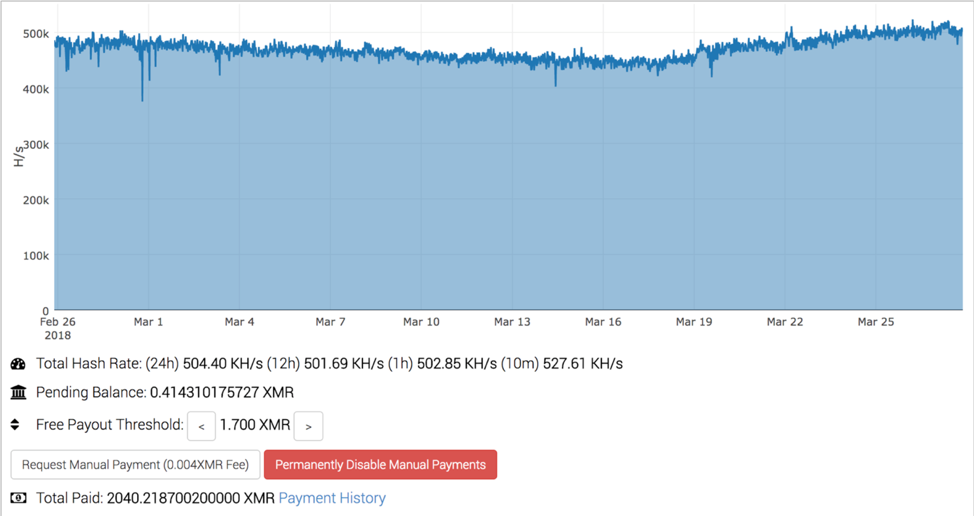
Figure 11 Example graph showing mining activity over time for a specific wallet address (3/3)
Conclusion
To date, the popularity of malicious cryptocurrency mining activity continues to skyrocket. The large growth of malware mining cryptocurrencies is a direct result of a previous spike in value, which has since corrected to a value that is more in line with expectations. As this correction has taken place, only time will tell if cryptocurrency miners will continue in popularity. It is clear that such activities have been incredibly profitable for individuals or groups who have mined cryptocurrency using malicious techniques for a long period of time. A total of $175m has been found to be mined historically via the Monero currency, representing roughly 5% of all Monero currently in circulation.
Defeating cryptocurrency miners being delivered via malware proves to be a difficult task, as many malware authors will limit the CPU utilization, or ensure that mining operations only take place during specific times of the day or when the user is inactive. Additionally, the malware itself is delivered via a large number of methods, requiring defenders to have an in-depth approach to security.
Palo Alto Networks customers have a number of means to combat this threat on their networks, including Traps and Wildfire detections for cryptocurrency miners delivered via malware. Additionally, the stratum App-ID may be used to identify cryptocurrency mining activity and take appropriate actions on it.
Readers may refer to the following list of all XMR wallets identified during this research. Additionally, hashes for the 629,126 samples are also being included.
Get updates from
Palo Alto
Networks!
Sign up to receive the latest news, cyber threat intelligence and research from us
By submitting this form, you agree to our Terms of Use and acknowledge our Privacy Statement.