We did not intend to hurt anyone. Our goal had been to help our neighbors in the Houston area get out of danger. Yet in 2015 the phone started ringing, and Internet messages started piling up, saying we were making safety worse. “You are doing a disservice,” said one public official from a district on Houston’s northern edge. A meteorologist chastised us: “How come you are telling people they are at low risk for flooding when there is flooding all around them?”
The messages were about our Web-based map, the Storm Risk Calculator (SRC), which we developed and operated for the city. We had designed it to tell residents which of them should flee in the face of an oncoming hurricane because their homes could be destroyed and who could stay because their house was likely to remain safe. The dangers were real: this region had been pummeled by Hurricanes Rita and Ike several years earlier. But clearly something about our map had gone wrong.
When cities near the coast like Houston face severe storms, evacuations seem the obvious way to protect people. But moving millions of people carries its own dangers. When Rita took aim at our area in 2005, officials told everyone to leave. Giant traffic jams turned Interstates 45 and 10 and U.S. Route 59 into parking lots as people at low risk fled, blocking escape routes for individuals who needed them most—residents directly in the path of high winds, heavy rain and storm surge. A few died on the road in the tremendous heat. A bus evacuating residents from a nursing home caught fire, igniting an oxygen tank and killing 23 onboard. So when Hurricane Harvey bore down on Houston last August, Mayor Sylvester Turner refused to evacuate. “You literally cannot put 6.5 million people on the road,” he said at the time. “If you think the situation right now is bad, you give an order to evacuate, you are creating a nightmare.”
On supporting science journalism
If you're enjoying this article, consider supporting our award-winning journalism by subscribing. By purchasing a subscription you are helping to ensure the future of impactful stories about the discoveries and ideas shaping our world today.
In the years after Rita and Ike, the three of us—an engineer, a computer scientist and a political scientist focused on public safety—decided to help Houston fix this nightmarish situation. We built our interactive SRC map to show safe and unsafe regions in the face of hurricane-force winds and storm surge. But we learned, after the complaints started piling up, that our map was focused on the wrong things. Houstonians and people in the surrounding area, Harris County, worry about major floods from heavy rainstorms, not just hurricanes, because the region gets a lot more of the former. People also wanted risk information on a much finer scale than our map provided.
This situation pushed us into a major research project to understand people’s views of risk and to develop new sources of data. As a result, we have rebuilt our risk map from the ground up, using more refined data about the dangers that truly affect homes and residents in our area. The new risk map, which will start live testing next year, integrates better data about more types of storms with cutting-edge artificial-intelligence technology, all to show people the risks to individual city blocks, as well as the best routes out. If the model works as we hope it will, it can be used by emergency planners to deploy resources in ways that have never before been available and to save more lives.
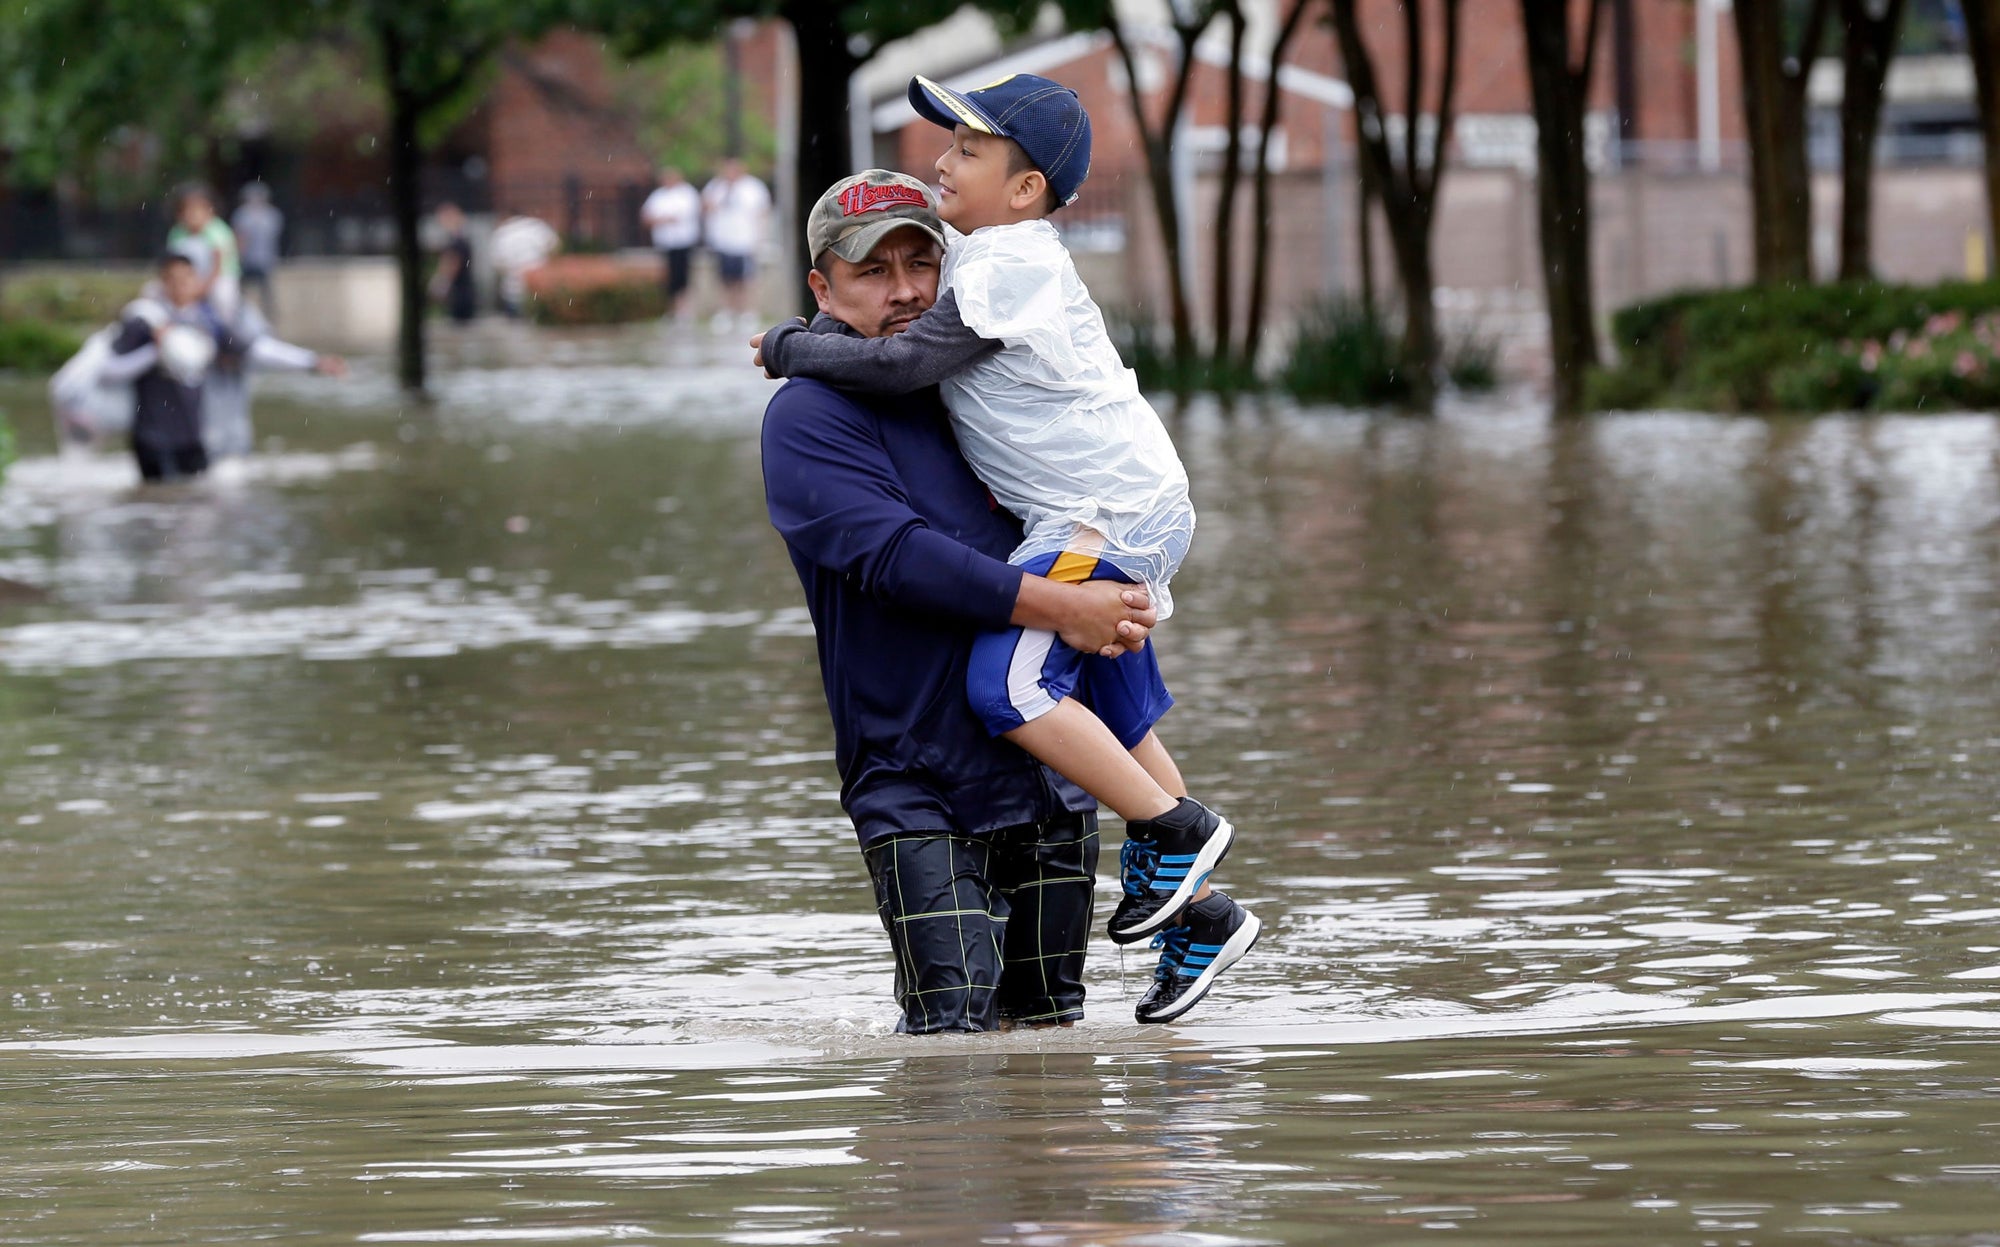
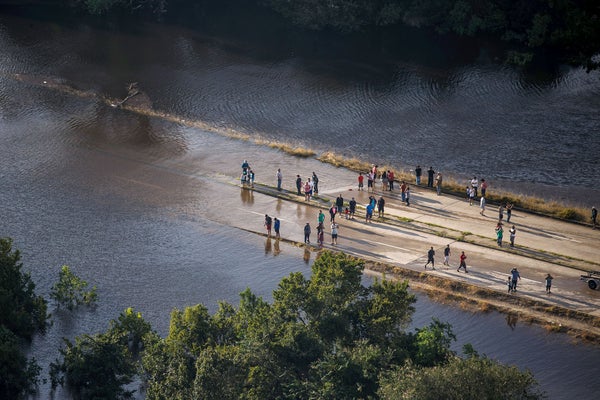
NOT JUST A RAINSTORM: In Houston, it does not take a hurricane to flood neighborhoods. Heavy downpours frequently imperil people and homes, as this storm did in 2016. Credit: David J. Phillip AP Photo
Calculated Risks
When we started the SRC project, we wanted to provide estimates of the main risks from hurricanes, including damage from storm surge, wind, rising water in bayous and power outages. We used data on real-time wind fields from the National Oceanic and Atmospheric Administration, along with rainfall levels reported by the Harris County’s Flood Warning System and home characteristics from the Harris County Appraisal District, such as the date of construction—which can reveal how strongly the roof is fastened to the walls. The resulting model predicted risk of house damage or power outage in different areas, in one-kilometer squares. When we tested it against various simulated hurricanes, as well as the actual damage from Hurricane Ike, the accuracy level in a typical square was better than 70 percent. Previous evacuation maps would give only a prediction based on things such as storm surges across an entire zip code, which can cover hundreds of square kilometers. So the new chart was a big improvement.
To picture the SRC in operation, imagine a hurricane in the Gulf of Mexico destined to hit Houston in a couple of days. One resident, Alice, simply needed to type in her address, and she would see a map. A color-coded, low-medium-high scale would indicate damage chances from wind, storm surge, bayou flooding and power outages. Her risks for wind damage would be fairly high. Alice’s two-story home, built in the 1960s, faced an open park in front of a bayou, and winds do not slow down in open areas. And the bayou would fill with wind-driven rain and raise her chances of flooding.
Another user, Bob, with a house about two kilometers away, would have a lower risk. Bob’s home, built in the 1990s, is just one story high and surrounded by trees. The lower house would catch less wind. The trees also would slow the winds, reducing their impact, and his more modern roof-to-wall connections would make his structure stronger. (Snapping tree branches, however, could come down on power lines and make electrical outages very likely.) Bob was also farther away from the bayou, lowering chances of flood damage. Better informed of their risks, Alice could decide to leave, while Bob could choose to stay, even though they were facing exactly the same storm.
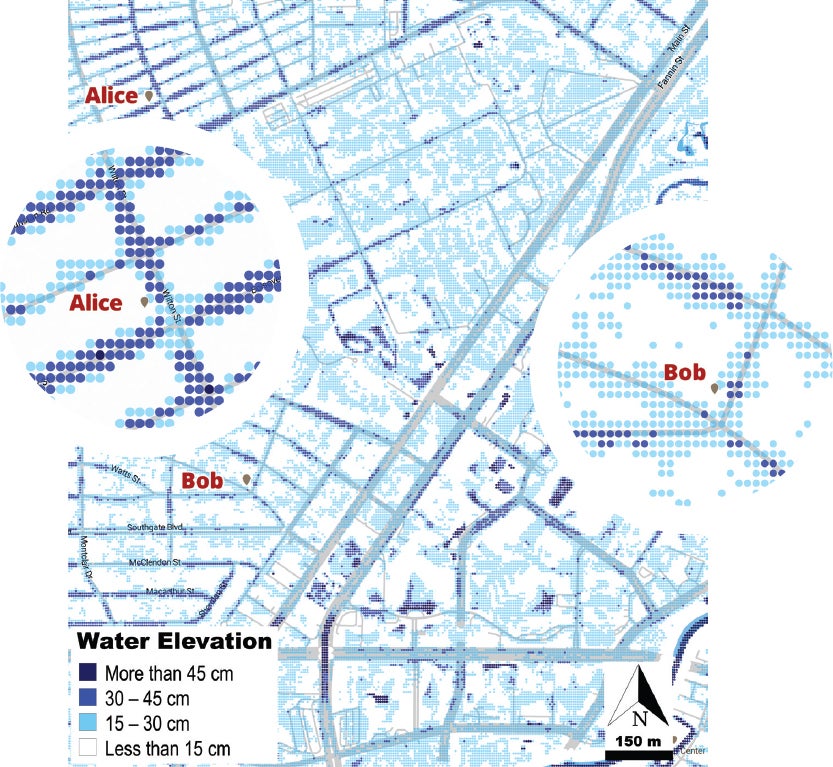
DANGER ZONES: This map of a two-square-kilometer swath of Houston, from the computer program HARVEY, predicts effects of a 20-centimeter rainstorm. One resident, Alice, would be flooded while another, Bob, would be at less risk.
Credit: Hesam Talebiyan, Jayant Patil and Kyle Shepherd Rice University
The calculator was popular right after the city announced it was up and running in June 2012. About 40,000 people used it in the days immediately after the launch. Usage soon leveled off to approximately 1,000 viewers a month and stayed that way for the next several years. But there was something odd. Houston did not have any hurricanes from the time we launched through 2016, yet map traffic spiked during large rainfall events. A heavy downpour can cause big problems. The city sprawls, and rapid urban and suburban growth has replaced water-absorbing meadows and stream channels with miles of concrete, which shunts water into neighborhoods and floods houses. In 2015 we had the Memorial Day flood and the Halloween flood. In 2016 we had the Tax Day flood. Twenty to 30 centimeters of rain—eight to 12 inches—fell during events like these; some bayous could not channel away all the water and topped their banks, and homes were ruined. When local forecasters started talking about several hours of heavy rain, people turned to our map.
Unfortunately, the map was not providing them the right information. It was designed to predict the effects of Gulf water driven inland by a hurricane and damage from 120-kilometer-per-hour-plus winds. Several dozen centimeters of precipitation dropping straight from the sky had different effects. Inland areas could get a lot of water, for example, but our map would not highlight that as a risk. That is when we started to get the complaining phone calls.
The last straw came in 2016, when the cloud server that held our SRC program was hacked. Hackers cut off our access and demanded money to give it back. It was a classic ransomware move. We had had enough. The more often the site appeared to give out misinformation, the greater the chance that people would lose trust in the program. It was time to shut the map down. We would pay no blackmail. But we would rebuild a risk calculator based on the actual needs of the Houston population, not on hurricane season alone.
Redrawing the Map
We started by reaching out to a close colleague, Rick Wilson, a behavioral social scientist at Rice University, who studies decision making. Together we designed a series of online experiments, using risk maps, in which hundreds of Houstonians were randomly assigned to various levels of data resolution and risk type. We focused on the time spent searching a map: more time indicated citizens’ interest in storm risks and their willingness to take action to prepare. Although big hurricanes—say, category four—got the most notice, attention disappeared if the geographical data on storm effects were not local. People were not interested in maps divided into areas that were a kilometer wide or partitioned by zip code. But when the map showed data on almost every block, hundreds of users sought more information. We also learned that, particularly in inland areas, projected rain amounts got more interest than projected storm surge levels. Serious rain events affect people’s mobility, productivity and safety.
These behavioral experiments showed that individuals pay the most attention to risks they perceive as most relevant to their own situation. This is obvious to us in hindsight, but think of how it contrasts with the way most storm information is handed out today—official blanket statements for rare events covering areas of many hundreds of square kilometers, such as entire counties and zip codes.
With our new focus on local events, we began to build a system around rainfall runoff and accumulation. We call it the Hurricane and Rain Vectorized Exposure Yielder, conveniently abbreviated to HARVEY. Our computer model HARVEY has a much finer geographical terrain grid than our earlier map, using cells that are only several square meters, instead of square kilometers. A single street can have many of these new squares, and the total for the city is more than 100 million of them. This configuration provides much more precise estimates of overland water flows and their depths when it rains intensely.
We used a variety of sources to derive these estimates. We had the history of National Weather Service forecasts and data, of course, but our model also incorporates the locations of calls to Houston’s 311 city information service to report local flooding. We can also draw on emergency calls to fire and police departments asking for help. Repeated calls from a particular location indicate recurring trouble spots. Harris County has a network of rain gauges, and we pull data from them. (We are also testing a wireless network of street-level flood sensors.) Our prediction models also include radar data that show how much water is held in the clouds heading for the city and how fast the wind is moving them. Slower winds give the clouds time to dump a great deal of water. That scenario produces a lot of nonhurricane flooding and was behind the inundation created by slow-moving Hurricane Harvey last year.
All these data are superimposed on a high-resolution terrain map, derived from the Houston-Galveston Area Council’s laser-driven remote-sensing system, which captures minute differences in ground height. The entire thing is integrated by AI programs that use fancy-termed techniques such as ensemble regression models, deep-learning algorithms and high-dimensional vector spaces. But the basic point is they are much more capable of combining different types of data sets than were the engineering models and mathematics we used for our original storm calculator.
We have tested HARVEY by giving it several sets of initial conditions seen prior to storms since 2015 and have asked the program to produce flood estimates for multiple places across the city. The predictions HARVEY has churned out have matched actual field observations of these storms well. The program does best with heavy downpours, more than five centimeters—two inches—per hour that last several hours, and in spots with poor drainage because of bayou overflows and bay tides. For smaller events, we will be calibrating HARVEY one watershed at a time over multiyear periods, to capture local factors and longer-term effects of climate change.
What would this mean for our worried Houstonians Bob and Alice? Our new map would provide them different levels of risk, with more attention paid to the history of flooding near Alice’s house and the height of the land around Bob’s. The key difference is that even if Bob and Alice lived two blocks apart, rather than two kilometers, they would be given different risk levels. With the erratic rainfall patterns across the city for any single event, users like Alice and Bob may find very different estimates of street flooding around their homes, their workplaces and the routes in between. Our HARVEY system will show users like them the dangers that affect route choices, the possibility of getting trapped at their locations and the likely levels of flooding for homes during rainfall events. It will help the city government allocate emergency and planning resources in advance, allowing first responders, such as the fire department, to get to people in trouble faster. Storm-mitigation projects can be located in areas that need them most.
Our plan right now is to publically launch a beta version of HARVEY in 2019, designed specifically for residents of the hard-hit Brays Bayou watershed. This waterway crisscrosses a neighborhood called Meyerland, where homeowners have been surprised by flooding multiple times during the past five years. Their residences have been wrecked, rebuilt and wrecked again. On many occasions people have been stuck in these houses, watching the water rise. We hope to give them better and earlier warnings. Our next step will be to expand the system to reach the rest of the city. Our team is entering into a collaborative agreement with the city of Houston, the Kinder Institute for Urban Research, and the Severe Storm Prediction, Education, & Evacuation from Disasters (SSPEED) Center to test and deploy HARVEY in stages toward future city-wide coverage. And if the model works for Houston, it could be adapted to other cities across the world that face similar problems from severe weather.
A changing global climate is going to make rainfall worse in our region, according to conclusions reached by a 2018 Houston severe storm conference organized by the SSPEED center. Storms will stagnate more frequently, dumping more rain as a consequence. Tools such as HARVEY will provide flood estimates at a scale that public officials and private citizens seek as they try to plan for this intensifying chronic rainfall and runoff. Most important, these tools will give people who must live under these clouds the ability to answer, for their own safety and that of others, one urgent question: Should I stay, or should I go?
A changing global climate is going to make rainfall worse in our region, according to conclusions reached by a 2018 Houston severe storm conference organized by the SSPEED center. Storms will stagnate more frequently, dumping more rain as a consequence. Tools such as HARVEY will provide flood estimates at a scale that public officials and private citizens seek as they try to plan for this intensifying chronic rainfall and runoff. Most important, these tools will give people who must live under these clouds the ability to answer, for their own safety and that of others, one urgent question: Should I stay, or should I go?