Article Text

Abstract
Objectives This research studies the role of slums in the spread and control of infectious diseases in the National Capital Territory of India, Delhi, using detailed social contact networks of its residents.
Methods We use an agent-based model to study the spread of influenza in Delhi through person-to-person contact. Two different networks are used: one in which slum and non-slum regions are treated the same, and the other in which 298 slum zones are identified. In the second network, slum-specific demographics and activities are assigned to the individuals whose homes reside inside these zones. The main effects of integrating slums are that the network has more home-related contacts due to larger family sizes and more outside contacts due to more daily activities outside home. Various vaccination and social distancing interventions are applied to control the spread of influenza.
Results Simulation-based results show that when slum attributes are ignored, the effectiveness of vaccination can be overestimated by 30%–55%, in terms of reducing the peak number of infections and the size of the epidemic, and in delaying the time to peak infection. The slum population sustains greater infection rates under all intervention scenarios in the network that treats slums differently. Vaccination strategy performs better than social distancing strategies in slums.
Conclusions Unique characteristics of slums play a significant role in the spread of infectious diseases. Modelling slums and estimating their impact on epidemics will help policy makers and regulators more accurately prioritise allocation of scarce medical resources and implement public health policies.
- delhi
- epidemic
- interventions
- slum population
- synthetic social contact network
This is an Open Access article distributed in accordance with the Creative Commons Attribution Non Commercial (CC BY-NC 4.0) license, which permits others to distribute, remix, adapt, build upon this work non-commercially, and license their derivative works on different terms, provided the original work is properly cited and the use is non-commercial. See: http://creativecommons.org/licenses/by-nc/4.0/
Statistics from Altmetric.com
Strengths and limitations of this study
We show that the unique attributes of slums must be accounted for in understanding the spread and control of infectious diseases.
We demonstrate that the granularity afforded by the agent-based model enables extraction of subpopulations, and subsets of interactions, to help interpret results.
This study does not consider age-specific susceptibility or immunity from past infections; all individual persons are assumed to be equally susceptible.
The disease transmission risk does not change across activity types; for example, an hour with an infected person at home or at work carries the same risk.
Colocation-based contact time is used as a proxy for physical proximity and short-distance, environmentally mediated transmission.
Introduction
Infectious disease is one of the leading causes of human morbidity and mortality worldwide. Reports from the Centers for Disease Control (CDC) show that over 200 000 people in the USA are hospitalised with influenza-like illness (ILI) symptoms each year, and the mortality on average is over 36 000 annually.1 2 In Delhi, India, a joint study by CDC, All India Institute of Medical Sciences and the National Institute of Virology has shown that ILI cases are present throughout the year, although they peak in rainy and winter seasons.3 It carries a significant economic burden through reduced productivity and high costs of healthcare.4–7 A CDC study finds that for outpatient and non-medically attended individuals, acute respiratory infections cost 1%–5% of monthly per capita income in India. In contrast, cost of inpatient care can be as high as 6%–34% of monthly per capita income.8 For developed countries, the annual cost of influenza is estimated to be between $1 million and $6 million per 100 000 people, according to the WHO.9
In 2007, India established an Integrated Disease Surveillance Programme, which included a network of 12 regional laboratories, to minimise the threat of avian influenza and other highly infectious zoonotic diseases.10 India faces some unique challenges in surveillance, prevention and control because of the seasonality of influenza at subregional levels. This seasonal variation depends on latitude, monsoon season, humidity and climatic factors of the regions. Acute respiratory infections are estimated to be 43 million per year, of which 4%–12% are due to influenza.11 12 Chadha et al 13 estimated hospitalisations due to respiratory illnesses to be 160 per 10 000 persons in year 2011, and children under the age of 5 had the highest incidence of them.
Given that influenza is environmentally mediated and spreads through close proximity, population density is an important factor in its spread. In India, the average population density is about 1000 people per square mile; in the slums, it can be 10–100 times higher.14 Larger household size and crowding make it easier to transmit infections.15–18 For example, Baker et al 16 find that meningococcal disease risk among children doubles with the addition of two adolescents or adults (10 years or older) to a six-room house. Other than overcrowding, slums are characterised by their lack of medical services,19 20 which makes slum residents highly vulnerable to infectious diseases. Diseases like cholera, malaria, dengue and HIV are common in slums across the world.21–23
This research uses Delhi, the National Capital Territory of India, where 13% of its 13.8 million people live in slum areas, as an example city to study the spread and control of influenza. Delhi is an interesting case study. It ranks fourth in the world in urban population, and among the top 25 largest urban areas, it ranks tenth in population density. Although Delhi is our target population, the results are likely to be useful in studying other slum areas within and outside of India because of the wide range of intervention types and parameter values examined.
This paper is an extension of the work done in Chen et al,4 which shows that slum populations have a significant effect on influenza transmission in urban areas. Ignoring the influence of slum characteristics underestimates the speed of an outbreak and its extent. However, Chen et al 4 do not consider any interventions on the epidemic spread. The focus of this research is to study the effect of different intervention strategies on several subpopulations (slum, age and gender) in two different Delhi networks, that is, original (referred to as network 1) and refined (network 2).
The original network used in Xia et al 24 studied the spread and control of influenza in Delhi using network 1, which did not take into account the special attributes of the slum population, such as larger family sizes and different types of daily activity schedules. Chen et al 4 used network 2, the refined social network of Delhi, which accounted for slum demographics and slum activities, but did not study intervention strategies. In network 2, there are 298 slum regions in Delhi, containing about 1.8 million people.
The goals of this work focus on understanding the effects of pharmaceutical interventions (PI) and non-pharmaceutical interventions (NPI) on epidemic outcomes. PIs include vaccinations, and NPIs are social distancing measures such as school closure, quarantine and staying home. These effects are studied comparatively: (1) in network 1 versus network 2, overall and for subpopulations in each; and (2) in the slum and non-slum regions of network 2. Additionally, in a scenario where interventions can be applied to a limited number of individuals, we explore how resources should be split between slum and non-slum subpopulations in order to achieve the best outcomes with respect to total infection rate (ie, the cumulative fraction of a population infected).
Methods
We use an agent-based modelling (ABM) approach to simulate the spread and containment of influenza in social contact networks of Delhi, India. We compare two networks: one considers slum-specific attributes, and the other does not. In this section, we describe the networks, the disease model for each agent, the interventions and the heterogeneities of the problem that make ABM uniquely suited to study epidemics. Throughout this paper, each agent in the ABM is an individual human.
Social contact networks
This study uses two synthetic social networks of Delhi, created in Xia et al 24 and in Chen et al.4 Details on their construction can be found in Xia et al,24 Chen et al,4 Barrett et al,25 Bissett et al 26 and references therein. The synthetic social network by Xia et al 24 is called network 1, and the more refined network developed in Chen et al,4 network 2.
It is important to note that while the social contact networks are inputs in epidemiological simulations, these networks are not specified directly. Rather, these networks are the outputs of population generation methods that are overviewed below and cited immediately above, and include activity surveys and demographic data, both inside and outside of slums. Thus, the topologies of the networks arise from the population generation process and its inputs.
Network 1 was developed in part from LandScan and Census data for Delhi, a daily set of activities of individuals, and the locations of those activities including geolocations of residential areas, shopping centres and schools, collected through surveys by MapmyIndia.com. By assigning activity locations to individuals’ activities, people are located at particular times at particular geographical coordinates (including office buildings, schools and others) and within particular rooms of buildings. Next, contacts between individuals are estimated when each person is deemed to have made contact with a subset of other people simultaneously present at the same location. This gives rise to a synthetic social contact network where network edges represent these contacts.
Network 2 models the slum regions in Delhi and assigns slum-specific attributes to the individuals whose homes reside in the slum polygons. Slum residents’ attributes and their daily sets of activities are collected through a ground survey in Delhi slums, by a vendor, IndiaMART (www.Indiamart.com/trips). The slum polygons are obtained from MapMechanic.com. Individuals living in the slum regions are a part of the slum population. All other individuals are part of the non-slum population. Network 2 is a geolocated and contextualised social contact network of Delhi with slums integrated in it.
Following are the main differences between the original network (network 1) and the refined network (network 2). The original social contact network 1 treats the slum regions like any other region in Delhi in terms of assignment of demographics and individual activities, that is, no special consideration is given to slum residents. The refined network 2 identifies 298 slum polygons (zones) in Delhi and assigns slum-specific demographics and activities to the individuals whose homes reside inside these polygons. Thus, the number of individuals is the same in both populations. The slum population constitutes about 13% (1.8 million) of the entire Delhi population of 13.8 million people. The main effect of integrating slums is that network 2 has more home-related contacts due to larger family sizes and more outside contacts due to more daily activities outside home. Also, those individuals who reside outside of slum zones have the same activities in both networks (but their contacts may change if their interactions include slum residents). Overall, there are over 231 million daily interactions between pairs of individuals. Online supplementary table 1 compares those two networks as well as data sources for slum and non-slum Delhi, India. For example, the average degree increases from 30.4 to 33.4 from network 1 to network 2, and the maximum degree increases from 170 to 180. We refer to Chen et al 4 for more detailed information about the two networks. Several plots of properties and structural characteristics of networks 1 and 2 are given in Chen et al. 27
Supplementary file 1
Disease model
An SEIR (Susceptible (S), Exposed (E), Infectious (I) and Removed or Recovered (R)) model is considered within each individual. Each node in the network represents an individual, and each edge represents a contact on which the disease can spread. A contact represents possible transmission between two people who are colocated for some duration (based on their activity schedules). This is an approximation to model direct contact and short-distance, environmentally mediated transmission that might include direct physical contact, fomite-mediated and airborne transmission.28
We start each epidemic simulation with 20 index cases, randomly chosen. (We find that results are not sensitive to the number of initial infections.) The detailed description of the SEIR model as well as the choices of transmissibility value, R0, the explicit incubation and exposed periods can be found in the online supplementary information. This disease model has been used in other works such as Liao et al 6 and Marathe et al. 29
The transmissibility value for disease transmission is that for the strong influenza model in Chen et al. 4 That work used mild, strong and catastrophic influenza models, so we chose the intermediate transmissibility. This corresponds to base attack rates (ie, cumulative infection fractions) of 0.42 and 0.48, respectively, in networks 1 and 2. These rates are generally higher than those in some other studies that either compute experimental attack rates from cases or compute them in modelling studies such as this one. Attack rates used by past researchers for different strains of influenza include Asia (0.22–0.50),30 South-East Asia (0.11–0.31 in children31; 0.05–0.6532) and India (0.111–0.23533; 0.074–0.42434; 0.045–0.29435; 0.008–0.10036; 0.209 for various strains13). The results in Chen et al 4 indicate that the results here, for this particular transmissibility, will be qualitatively the same for other transmissibilities, but will scale down or up as transmissibility changes in the same direction.
Interventions
This work considers three vaccination scenarios, that is, vaccinate when cumulative infection rate is 0% (VAX0, ie, vaccinate on day 1), 1% (VAX1) and 5% (VAX5). Three classes of social distancing strategies are considered: (1) stay-home (SHO) if infected, that is, eliminate all non-home-related contacts but continue to maintain contacts within the household; (2) close-schools when cumulative infection rate has reached 1% (CS1) and when it has reached 5% (CS5), that is, eliminate school-related contacts; and (3) isolation (ISO), in which all contacts, including home contacts, of a person are eliminated when a person becomes infectious. For vaccination, five different compliance rates (10%, 30%, 50%, 70% and 90%) and two different vaccine efficacies (30% and 70%) are considered.
VAX0, SHO and ISO are all fairly aggressive interventions because they are implemented either before a person gets infected or immediately on becoming infectious. These are actions taken at the individual or family level. For example, vaccination before the influenza season or isolating a sick child at home is a family decision. Even CS1 is an aggressive intervention in the sense that this action is taken by government officials based on aggregate school sickness levels—closing schools before any outbreaks is typically not done. From these starting points, vaccinations when 1% or 5% of the population is infected (VAX1, VAX5) and closing schools when 5% of the population is infected (CS5) are less aggressive treatments. The five levels of compliance are also variations on aggressiveness in treatments.
These conditions and parameters are consistent with results from other studies and guidelines put out by international organisations. A meta-study of immunisation and slums37 identifies several vaccination-related studies of slums in India. Unfortunately, these studies are for other diseases such as hepatitis B, measles, mumps, malaria and typhoid fever. Nonetheless, slum vaccination rates for children over these ailments range from 25% to 69% for full immunity and from 15% to 55% for partial immunity. Vaccination effectiveness for ILI in India was determined to be about 33%–36%.38 In 2012–2013, of 1000 pregnant women in Srinagar, India, none were vaccinated against influenza.39 With regard to school closures, the WHO states that school closures may be undertaken proactively (before an outbreak) or reactively (after influenza starts to spread).40 WHO recommends that school closure occurs before 1% of the population becomes infected. It also recommends that people (students and staff) stay home when they feel ill. In another meta-study,41 it was found that school closure, effected when 0.1% of the population was infected, was twice as effective in reducing the total attack rate as school closure occurring after 1% of the population was infected. Moreover, the percentage of people infected before school closure was triggered varied between 0.02% and 10% across several studies.
When a susceptible node is vaccinated, its probability of getting infected by an infectious node is scaled down by the efficacy. If it becomes infectious, its probability of infecting susceptible nodes is also scaled down by the efficacy. In other words, both incoming and outgoing infection probabilities of vaccinated individuals are reduced by the vaccine efficacy. Interventions are applied to slum residents, non-slum residents and the entire region of Delhi.
For each experiment, 25 replicates are simulated for 400 days, and their mean results are reported. The averages are timepoint-wise averages; for example, the mean infection rate at day 100 is calculated by taking the average of the 25 infection rates that occur on day 100 of each replicate. Online supplementary table 2 summarises all the interventions considered, and online supplementary table 3 contains all variables in simulations, including intervention parameters.
Heterogeneities captured
There are several heterogeneous aspects to this problem that motivate the use of an ABM approach: (1) the 298 slum zones have populations that vary by more than four orders of magnitude in size; (2) the geographical extents of slum zones differ; (3) the slum zones are located at irregular spatial intervals throughout Delhi; (4) the activity patterns of people living in slums are different from those in the non-slum region; and (5) each individual interacts with specific others based on colocation.
The implications of these heterogeneities include the following: First, the particular synthetic households that live within slums are predicated on the number of slum zones, their locations and their spatial geometries. These homes have larger family size and hence more home contacts. Second, slum individuals have different activity patterns which change the colocated contacts of each slum person: that is, with whom they interact and for how long. For example, see the supplementary information of Chen et al. 27 The average total contact durations by activity type and by slum/non-slum residents are provided, which show that non-slum people have greater contact durations for work, school and college activities, but less for home and other types. Overall, a slum person has about 50% greater total contact duration per day compared with a non-slum person. The same supplementary information shows that in the age range 20–60 years (by year), women who live in slums have more contacts per day than their male counterparts. However, women whose homes are outside of slum regions have average number of daily contacts that are below their male counterparts.
Results and analysis
Our results are grouped as follows: (1) comparison of network 1 and network 2 for base case and intervention cases; (2) results for both networks based on demographic classes, such as slum/non-slum, gender and age groups, for a wider range of intervention strategies; (3) comparison of network 1 with the non-slum population of network 2; (4) effects of PIs and NPIs for a wide range of parameter values; and (5) effects of different resource allocation strategies.
All differences are tested with the two-sample t-test and they are all statistically significant with P values smaller than 2.2e-16. The 95% CIs are given for each comparison. Here is a brief summary of selected results with examples of mechanisms, to provide a high-level overview. Details of results follow this summary, and these details matter because there are many factors (inputs) in a simulation whose interactions change results.
Ignoring the unique attributes of slums in a population overestimates the benefits of the interventions. For example, in the case of vaccination intervention (efficacy 30% and compliance 30%), the values for the epidemic size (ie, cumulative percentage of infected), peak infection rate (ie, maximum percentage of a population infected on any day) and time to peak are 33.1%, 3.0% and 184 days, respectively, in network 2, whereas they are 23.3%, 1.34% and 286 days in network 1. In relative terms, the epidemic size and peak infection rate are underestimated by 42.2% and 123.2%, respectively, while the time to peak is overestimated by 35.7% in network 1 (see figures 1 and 2 and online supplementary table 4). The larger family sizes for slum families in network 2 and the increased number of edges result in larger outbreaks and faster time to peak infections.
Interventions are more effective in network 1 than in network 2 for all types of interventions: vaccination, closing schools, staying home and isolation. These trends also hold over wide ranges of efficacy and compliance (see figures 3, online supplemental figures 1 and 2). Hence, not accounting for slums gives overly optimistic results for the effectiveness of the interventions. The reduced average family size in network 1 means fewer within-home edges, which slows infection and reduces spreading. Closing schools and staying home interventions do not affect home edges. However, the magnitude of this effect varies with intervention conditions (eg, compliance rate, time at which intervention is applied).
Cumulative infection rates by subpopulation in network 2 show that slums sustain greater infection rates than non-slums under all intervention scenarios, sometimes by as much as 44.0% (see figure 4 and online supplementary table 5 for more details). This is due to the greater household sizes in slums.
For network 2, under a wide range of intervention compliance rates (10%–90%), the ISO strategy is up to 32% more effective in containing an outbreak than vaccination (for 30% efficacy). Staying home is up to 18% more effective than vaccination at 50% compliance (see figure 3 and online supplementary table 6 for more details). Isolation, although hard to implement from practical considerations, is most effective because edges to susceptible individuals are removed (isolation also provides a good comparative case). Differences between staying home and vaccination depend on compliance rates.
For network 2, delay in triggering interventions has 7.3%–44.0% more adverse effect in slums than in non-slum regions across compliance rates from 10% to 90% (see figure 4 and online supplementary table 7 for more details). Early interventions mean actions are taken when outbreaks are smaller and are therefore more readily contained.
Comparison of network 1 (figure 3A) with the non-slum population (figure 4B) of network 2 shows that just the presence of slum-specific activities and interactions with non-slum population makes social distancing-based interventions less effective in the non-slum regions of network 2.
A full-factorial design that splits resources between slum and non-slum regions indicates that the most effective intervention is to give vaccines to slums and apply social distancing to non-slums. Applying vaccine and social distancing to slum regions is the next most effective intervention (see figure 5). By applying social distancing to non-slums, these individuals are kept isolated from slum individuals who are infected. The greatest benefits accrue to the slum populations.
Comparison between networks 1 and 2: base case versus interventions
We start with a comparative analysis of the influenza epidemic, with and without interventions, on network 1 and network 2, to measure the impact of integrating slums in the population on epidemic measures. Figure 1 shows the average simulation time histories for the base case, and when vaccination is applied randomly to 30% of the population in each network with vaccine efficacy set at 30%. Simulations for other vaccine efficacies and compliance rates give qualitatively similar results. Two sets of those results are shown in online supplementary figures 1 and 2. Note that network 1 does not distinguish between slum and non-slum individuals, so the epidemic curve is not split by subpopulation.
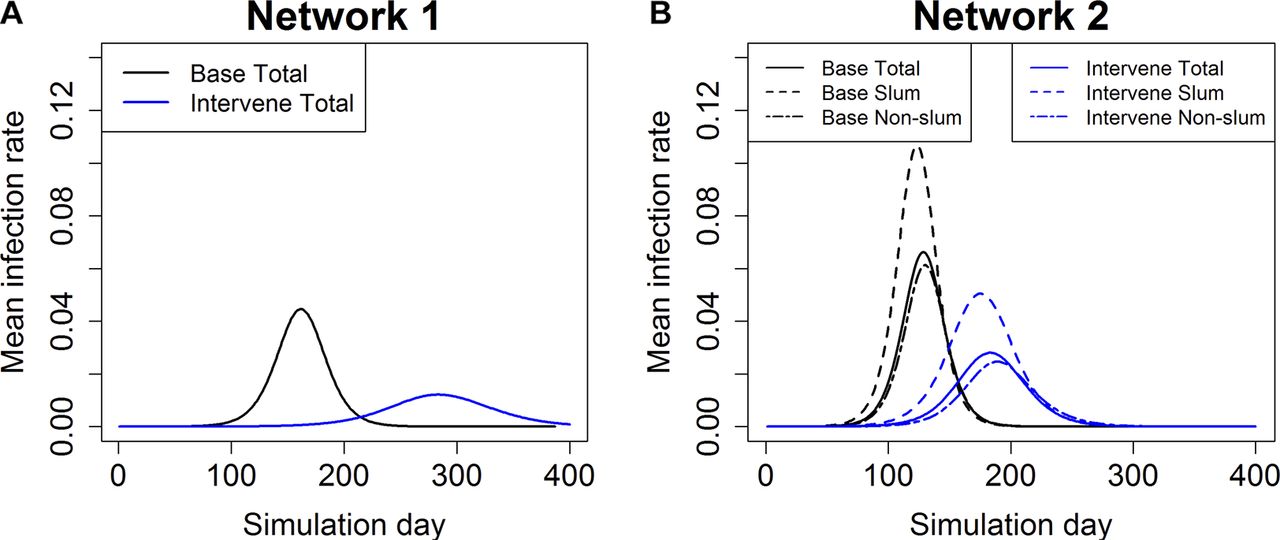
Epidemic curves for base case and vaccination case in (A) network 1 and (B) network 2. Each timepoint in the curve is an average over 25 replicates. The vaccines are given randomly to 30% of the entire population and the vaccine efficacy is 30%. For network 2, epidemic curves are shown for total population and slum and non-slum subpopulations. ‘Intervene Total’ refers to the epidemic curve of the entire Delhi population when the vaccine intervention is applied. ‘Intervene Slum’ refers to the epidemic curve for just the slum population, and ‘Intervene Non-slum’ refers to the epidemic curve for just the non-slum population for the intervention case. Epidemic curves for a variety of compliances and efficacies are reported in online supplementary figures 1 and 2. (A) Total Delhi network 1 and (B) Total Delhi network 2.
Results in network 2 differ significantly from results in network 1 for both the base case and intervention case. In network 2, the epidemic starts earlier, peaks earlier, has a larger epidemic size and has higher peaks compared with the corresponding epidemic quantities in network 1. Thus, if policy planners ignore slums and use network 1 to plan, there will be a false sense of security and lack of urgency to implement interventions. For both the base case and the intervention case, ignoring unique characteristics of the slums will result in an underestimation of the infections and the speed of spread.
For the intervention cases, the time to peak infection decreases by 35.7%, that is, from 286 days for network 1 to 184 days for network 2, meaning an influenza epidemic would peak roughly 100 days earlier than one would expect based on the results from network 1. For the base case, time to peak infection drops by 20.8%, that is, 34 days’ reduction for network 2 as compared with network 1.
Percentage changes and differences must be viewed cautiously, and to illustrate this point we present data for the key parameters in online supplementary tables 4 and 8. The difference in the peak infection rate (ie, the maximum fraction of daily infected individuals during the simulation) between networks 1 and 2 for the base case is 2.2%, or 47.6% in percentage change (see online supplementary table 8). For the intervention case shown in online supplementary table 4, the difference between the two networks is less (1.7%), but the percentage change is more (123.2%) because the magnitudes of the peak infection rates are reduced when effective interventions are used. We make note of this here and mainly use the percentage change values in discussing results. For more detailed comparison between vaccination intervention and the base case in network 1 and network 2, we refer to supplementary tables 7 and 9 and supplementary figures 4 and 5.
Comparison between networks 1 and 2 based on individual demographic information
We divide the Delhi population into strata by age, gender and geographical home location (ie, slum and non-slum), and analyse the mean cumulative infection rates by subpopulation for the two networks. In simulations, individuals are chosen at random in the entire network for vaccination. Various vaccination scenarios are investigated.
Figure 2 displays the cumulative infection rate results. On the x-axis, ‘Total’ refers to the entire population of Delhi. There are three breakdowns of the entire population. ‘Slum’ and ‘Non-slum’ refer to slum and non-slum regions, respectively. ‘Male’ and ‘Female’ denote the total number of men and women in Delhi, respectively. Four age groups are considered: ‘Preschool’ (0–4), ‘School’ (5–18), ‘Adult’ (19-64) and ‘Senior’ (65+). The black lines correspond to the mean cumulative infection rates for the base case. Other curves indicate vaccination strategies under different levels of vaccination rate (v) and vaccine efficacy (α). Two vaccination rates (30% and 50%) and two vaccine efficacy rates (30% and 70%) are shown in the figure.
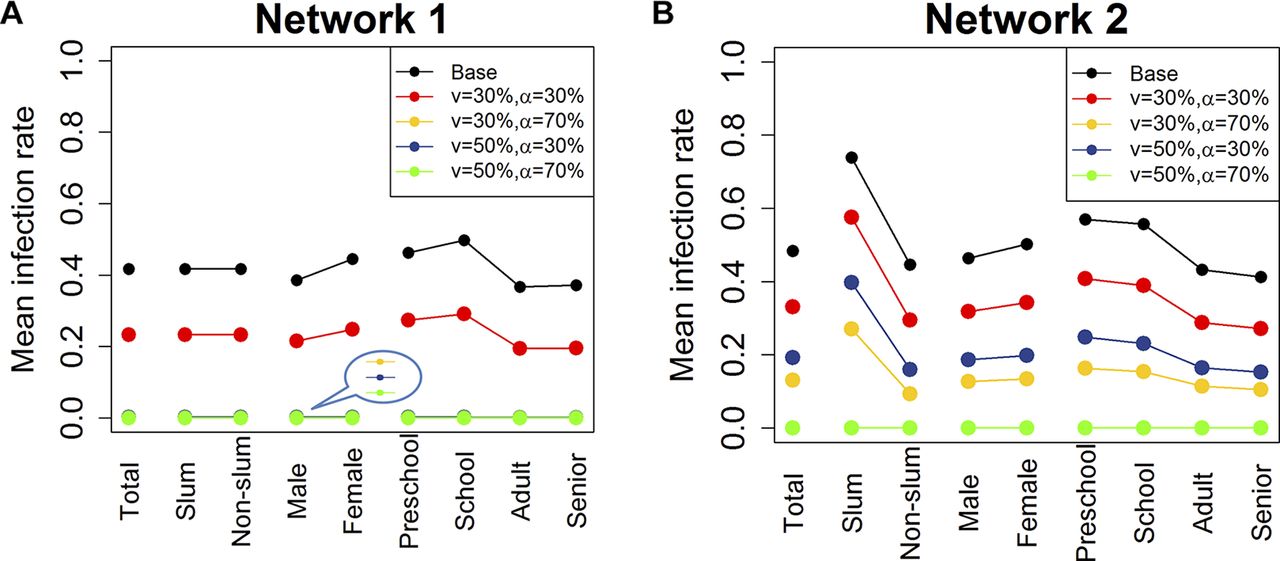
Mean cumulative infection rates for different subgroups in the two networks. Two vaccination rates (v=30%, 50%) and two vaccine efficacy rates (α=30%, 70%) are considered. Individuals are chosen at random in the entire network for vaccination on day 0. Mean infection rates are calculated within each group. The last several lines in the plot for network 1 are overlapping at the bottom because the mean infection rates are almost 0 under those scenarios. ‘Total’ refers to the entire population of Delhi. ‘Slum’ and ‘Non-slum’ refer to slum and non-slum regions, respectively. ‘Male’ and ‘Female’ denote the total number of men and women in Delhi, respectively. Age groups are denoted by ‘Preschool’, ‘School’, ‘Adult’ and ‘Senior’. (A) Total Delhi network 1 and (B) Total Delhi network 2.
For network 1, vaccination rate of 50% or higher stops the epidemic for all categories of individuals, regardless of vaccine efficacy. An efficacy of 70% also contains the epidemic, given a vaccination rate of at least 30%. In comparison, for network 2, either a vaccination rate of 70% is required (not shown in plot for clarity), or a vaccination rate of 50% combined with a vaccine efficacy of 70% is required to stop the epidemic for all categories of individuals.
In network 1, slum and non-slums are treated the same so the infection rates are identical in figure 2. However, all scenarios in network 2 show a higher burden of disease on the slum population. This is due to the fact that slum households have larger family size and more contacts on average than households in non-slum areas (see Chen et al 27). As shown later, we find similar patterns of infection in slum and non-slum subpopulations for other interventions such as ‘close-schools’ and ‘stay-home’.
The results in both figures 1 and 2 indicate that ignoring the effect of slums results in overestimation of the benefits of interventions in terms of reduction in the mean cumulative infection rate and peak infection rate, as well as the time to peak. This optimism holds for slum, non-slum and total population under various levels of vaccination rates and efficacy rates in network 2 (see online supplementary table 10 for more detailed comparison of results between slum and non-slum in network 2).
Comparison between networks 1 and 2 across a wide range of intervention strategies
Next, we consider a variety of intervention strategies for comparative analysis. We consider vaccination (VAX), school closure (CS), stay home (SHO) and isolation (ISO) strategies. For vaccines, three different trigger points are considered: when cumulative infection rate reaches 0% (VAX0), 1% (VAX1) and 5% (VAX5). For CS, two trigger points are used: when the cumulative infection rate reaches 1% (CS1) and 5% (CS5). Under the SHO strategy, all non-home activities and interactions are eliminated, but all contacts within the household are maintained. Under ISO an individual has no contact with other individuals (even home interactions are eliminated). The SHO and ISO interventions are implemented for compliant infectious individuals, after they become infectious, for the entire infectious duration.
Figure 3 displays average cumulative infection rates in network 1 and network 2 for a wide range of intervention strategies. For each strategy, five different compliance rates are considered, that is, 10%, 30%, 50%, 70% and 90%. The cumulative infection rates (ie, fractions) are displayed as larger numbers in boxes, while smaller font numbers are the actual number of infected individuals. Darker colours correspond to higher infection rates. Note that compliance rate is simply the vaccination rate for strategies VAX0, VAX1 and VAX5. Compliant individuals are selected at random from the entire population. The ‘Base’ values do not vary with compliance because the base case has no intervention. Note that all heat maps in this paper use the same colour scheme so that colours can be compared across figures.

Mean cumulative infection rates under different interventions for (A) network 1 and (B) network 2. The larger font numbers are fractions of populations that are infected and the smaller font numbers are counts of infected individuals. Colours of the boxes correspond to the values of the large numbers (ie, fractions of infected), and the same scheme is used for both plots for comparisons—and for all plots in this paper. Five different compliance rates are examined (10%, 30%, 50%, 70% and 90%), and four types of intervention strategies (vaccination (VAX), close-schools (CS), stay-home (SHO) and isolation (ISO)) are considered. For vaccines, three different trigger points are considered: when the cumulative infection rate reaches 0% (VAX0), 1% (VAX1) and 5% (VAX5) of the total population. The vaccine efficacy is set at 30%. For CS, two trigger points are used: when cumulative infection rate reaches 1% (CS1) and 5% (CS5). Compliant individuals are selected at random from the entire Delhi population, and the cumulative infection rates are calculated for each network. Base is the baseline case with no interventions. (A) Total Delhi network 1 and (B) Total Delhi network 2.
Since network 1 does not distinguish between slum and non-slum populations, we only compare the two networks for the whole of Delhi. The general pattern is similar for both networks. However, all interventions have a larger effect on network 1 under the same compliance rate (ie, corresponding numbers are uniformly lower for network 1 than for network 2). The infection rates drop to 0 at a smaller compliance rate for VAX0, SHO and ISO strategies in network 1 as compared with those for network 2.
At a high level, among all intervention strategies, early vaccination (VAX0 and VAX1), ISO and SHO are more effective than the other strategies, and this is more readily observed at higher compliance rates. For these more effective strategies, the interventions per person are implemented right after (or very shortly after) the person is infected. For example, SHO is implemented immediately after a person becomes infectious. Thus, a person who becomes infectious can infect their family members, but if these other members become infectious, then they, too, will be confined to home. Thus, home-bound people can infect their family members, but no one beyond their family (for 100% compliance). As compliance rate increases, this effect approaches, roughly, a ‘family-based’ isolation intervention (similar to ISO), consistent with the results in figure 3 and in subsequent results.
Effect of vaccination versus social distancing on slum and non-slum subpopulations
We now compare the impact of vaccination and social distancing on slum and non-slum subpopulations from network 2. Social distancing interventions are CS, SHO and ISO.
The mean cumulative infection rates (and actual numbers of infections underneath) for each compliance level are shown in the heat maps in figure 4 for slum and non-slum populations in network 2. The axis labels are identical to those in figure 3, as is the colour scheme of the cells. The base case values are constant since there is no intervention and hence no compliance. Darker colours correspond to higher infection rates.

Heat map of cumulative infection rates in (A) slum and (B) non-slum regions of network 2 under different intervention conditions. The colours of boxes correspond to the larger numbers in the boxes—the cumulative infection rates—and the two plots use the same scheme for comparisons. Darker colours correspond to higher infection rates. The smaller font numbers are counts of infected individuals. The vaccination efficacy is fixed at 30%. Five different compliance rates (10%, 30%, 50%, 70% and 90%) and four types of intervention strategies (vaccination (VAX), close-schools (CS), stay-home (SHO) and isolation (ISO)) are considered. For vaccines, three different trigger points are considered: when cumulative infection rate reaches 0% (VAX0), 1% (VAX1) and 5% (VAX5). For CS, two trigger points are used: when the cumulative infection rate reaches 1% (CS1) and 5% (CS5). Compliant individuals are selected randomly from the entire Delhi population, and the mean infection rates are calculated separately for the slum and non-slum subpopulations. Although not reported here, qualitatively similar results are found for other transmission rates, as well as for higher vaccine efficacy (70%). Base is the baseline case with no interventions. (A) Slum region of network 2 and (B) Non-slum region of network 2.
Compared with the base case, all interventions reduce infection rates to some extent. As the compliance rate increases, infection rates drop for all interventions. Infection rates drop to 0 in slum and non-slum regions at a compliance level of 70% or higher, under SHO, ISO and VAX0 strategies. Early interventions or lower trigger levels reduce the infection rates significantly, and this effect increases with compliance rate.
The following observations can be made from figure 4. Social distancing, that is, SHO, at low and intermediate compliance and CS at all compliance levels, is less effective in slum regions as compared with non-slum regions. This is because CS only eliminates school interactions for those attending school, and there are fewer school edges in slums compared with non-slum areas, as shown in online supplementary figure 6. The effectiveness of CS in slums is mitigated by the greater average number and duration of interactions at home in slums as compared with non-slums (see online supplementary figure 6 and Chen et al 27). Thus, if a person is sick, there is a greater chance of transmitting contagion to family members, who then may have activities outside of school, thus circumventing the CS intervention. At high compliance, SHO is effective because all interactions outside home (including school) are eliminated.27
These observations are also supported by supplementary figure 7, which contains numbers of edges used to transmit contagion for a base case run of figure 1. There are several effects that bear on the above observations. First, in the cases of activities ‘work’, ‘other’ and ‘school’, the number of edges transmitting contagion from slums to non-slums is greater than the reverse: from non-slum to slum. Second, in two of these three activity categories, there are more slum to non-slum transmissions than slum to slum transmissions. Edges of transmission for slum dwellers are dominated by home interactions. The infected homes in slums serve as launching points to drive disease to non-slums through slum to non-slum interactions. (There are no ‘mixed’ edges at homes, and shopping and college activities have low levels of slum activity because of socioeconomic factors.) We will see the effects of these mechanisms in figure 5, but we now return to figure 4.

Mean cumulative infection rates for each category listed on the x-axis, for network 2 and network 1, under four different intervention scenarios. The colour scheme of the boxes is based on the large values in the boxes—the cumulative infection rates. Darker colours correspond to higher infection rates. Smaller font values are the number of infected individuals. The vaccine efficacy is set at 30%. VsSs refers to the case when vaccines and social distancing are both applied to slum residents; VnSn refers to the case when vaccines and social distancing are applied to non-slum residents. Similarly, VsSn means vaccines are given to slums and stay-home is applied to non-slums; and VnSs means vaccines are given to non-slums and stay-home is applied to slums. Base refers to the case where no intervention is applied.
Isolation works well at 30% or higher compliance rates, but it is a much harder strategy to implement, especially in slums. However, it is considered here for comparative analysis. Vaccination also produces marked decreases in cumulative outbreak sizes as compliance increases. However, CS is generally less effective because this intervention removes only a fraction of interactions for a fraction of the population, that is, school-aged children. Simulations were also run for 70% vaccine efficacy. Since results are qualitatively similar for those parameters, these plots are provided in online supplementary figure 3.
Comparison between network 1 and non-slum areas of network 2
Note that network 1 treats all parts of the region as non-slum, that is, all individuals follow non-slum activities and demographics. In order to capture the additional disease risk to the non-slum population that arises from the interactions with the slum population, we compare network 1 in figure 3A with the non-slum population of network 2 in figure 4B. In base case, the additional disease risk to the non-slum population goes up from 42% to 45%. However, the beneficial effects of social distancing strategies drop by a large amount; for example, CS strategies are 5 to 20 percentage points less effective in the non-slum areas of network 2. This effect changes non-linearly with the compliance rate. As compliance rate goes up, the difference between performance of network 1 and non-slum parts of network 2 goes up in CS1 and CS5. This implies that in network 2, non-slum population requires much higher levels of compliance to achieve the same results as in network 1. This difference is less stark for vaccination-based interventions, that is, VAX0, VAX1 and VAX5. This is expected since the effect of vaccination is less dependent on interactions; it is only through herd immunity that interactions come into play.
Constrained resource allocation among slum and non-slum areas
We consider a specific scenario under network 2. If only a limited number of vaccines are available, and only a certain fraction of individuals can be kept home during an epidemic, how should these interventions be applied to the slum and non-slum regions so that the epidemic can be controlled effectively? Given that slum residents’ attributes differ from those of non-slum residents, is there a strategy that works better in slums than in non-slum areas? The total population in Delhi is about 13.8 million, which includes about 1.8 million slum residents. We assume that only 10% of the total population can be covered by interventions, half through vaccination and the other half through stay home. Enough vaccines are available to cover 5% of the total population (ie, 692 183 vaccinated, corresponding to about 38.25% of slum or 5.75% of non-slum population), and 5% of the individuals can stay home (692 183 individuals; this is applied to only the infected individuals). Note that an individual may receive a vaccine and also stay at home if this individual, in spite of being vaccinated, gets infected.
We consider four different ways of applying interventions to 10% of the total population: (1) apply both interventions to slums, that is, give all vaccines to slums and apply SHO only in the slums (VsSs); (2) apply all interventions to non-slum areas (VnSn); (3) give vaccines to slums and SHO to non-slums (VsSn); and (4) give vaccines to non-slums and apply SHO to slums (VnSs).
For both types of intervention, the same number of individuals is chosen randomly from slum or non-slum areas. Ten per cent of the total Delhi population amounts to 76.5% of slum population, 11.5% of the non-slum population, or a combination of 38.25% of the slum and 5.75% of the non-slum population (ie, half from slums and half from non-slums). Figure 5 shows the mean cumulative infection rates, as well as the number of infected from the entire population of Delhi, and the slum and non-slum areas under each of the four scenarios. The first three columns refer to network 2, and the last column shows results for network 1. Since network 1 does not distinguish between slum and non-slum areas, the infection rates in each subpopulation remain the same as for the total population.
Comparison of the last two columns in figure 5 indicates that the non-slum population in network 2 faces 3%–5% additional disease risk compared with network 1 in all cases. This is primarily driven by the increased interactions within slum populations and between slum and non-slum populations in network 2.
In figure 5, all four intervention strategies produce essentially the same total attack rates (around 43%–44%), a drop of 4%–5% over the base case. The dominant effect on network 2 is the benefits that primarily accrue to the slum population for the VsSs and VsSn strategies because they drive down the fraction of infected slum residents from 0.74 to 0.55 or 0.58. Also, as described in the context of figure 4 and online supplementary figure 6 above, social distancing of the non-slum residents helps to isolate them from the infected slum residents. Results such as these may be helpful to policy makers in breaking the poverty trap in economically poor regions.42
Also, the strategy of vaccinating non-slums and social distancing slums (VnSs) is not as effective as the interventions in rows 1 and 2 of figure 5. This is a counterintuitive result, since the density of population is much higher in the slums, which may lead to the belief that social distancing in slums will break up the dense clusters. However, a careful examination shows that keeping slum residents home is not an effective social distancing strategy because their family size is, on average, almost three times the family size of non-slum households.27 The high level of mixing at home makes social distancing ineffective in slums unless the infected individual is completely isolated. However, complete isolation is not viable in slum areas where the entire household may live in a single room.
Discussion
With slum populations expected to grow to two billion by 2030,43 it is becoming increasingly urgent to understand how to control the spread of infectious diseases in slum areas and measure its effect on urban populations. To our knowledge, a detailed study of interventions to control influenza epidemics in slums, using an agent-based simulation model, has never been done before. Slum conditions are important for a city beyond the direct effects of disease transmission. For example, civil wars may be precipitated or exacerbated by disease outbreaks because they decrease social health and welfare.44
Even though slum regions contain only 13% of the total population of Delhi, Chen et al 4 show that omitting their attributes leads to underestimation of the overall infection rate and the peak infection rate of the epidemic. This paper extends that work by evaluating the differential impact of interventions on slum and non-slum regions. Various vaccination and social distancing strategies are analysed under different scenarios that show that the slum population is more prone to infections under the same control measures. Furthermore, taking account of slum populations significantly alters the disease dynamics in the entire population. Differences in key measures are demonstrated between the cases of accounting for slum populations and not: for example, a 100% increase in the peak attack rate in some cases when slum regions’ characteristics are taken into account, compared with the case when they are ignored.
Figure 4, which compares infections in slum with non-slum areas, shows that at very high compliance rates, some interventions can be equally effective in both slums and non-slums. However, such high compliance rates are typically not feasible due to practical realities on the ground, and also because they require timely diagnosis of infected cases. For SHO to be effective, the coverage rate needs to be 70% or more in both slums and non-slums, and the diagnosis of the infected individuals needs to be correct and immediate. In other words, effective control of a contagious epidemic in a high-density place like Delhi would require either early and drastic action (eg, ISO) or a highly compliant set of individuals, or a combination of these features.
This work overall demonstrates the power of agent-based and population modelling to evaluate complicated interaction-based epidemiological phenomena. Clearly, there are limitations to this work (several are itemised below). But these agent and population approaches provide a platform for adding additional complexity. All of the figures demonstrate that quantitative results depend on complicated interplay among inputs. These results are important because they inform policy decisions. An equally important benefit of this type of work, but not often stated, is developing intuition about epidemic dynamics (in this case, with the effects of slums) to enable decision makers to reason about nuanced interactions among effects to a degree that is hard to obtain with other approaches that lack this level of detail. However, we believe that other modelling approaches may also be valuable in understanding epidemic dynamics in slum populations.
Despite the detailed modelling effort, there are limitations to this work and areas for improvement in the future. For example, this model assumes that both slum and non-slum individuals have the same level of immunity. This may not be true for seasonal infections. Previous researchers have argued that individuals who live in smaller family sizes, who have access to household amenities and maintain a high level of personal cleanliness face declining microbial exposure, which can modify their immune response and reduce their level of tolerance to respiratory infections.45 Slum households characterised by larger family size and overcrowding are likely to encounter much higher microbial exposure and therefore may be protected by their greater immunity.16 17
Areas for future work include (1) examination of different population level base attack rates derived from different transmission probabilities; (2) different susceptibilities and infectivity for individual agents, for example, based on age; (3) effects of asymptomatic infections (although we have addressed this to some extent with compliance and efficacy of interventions); (4) seasonal effects46 47; (5) effects of immunity for an individual from previous infections (in previous seasons); (6) evaluation of interaction of different strains from season to season; (7) comparison of tropical versus subtropical factors; (8) evaluation of a specific outbreak scenario; (9) impact of sickness on absenteeism from work and its economic ramifications; (10) effects on rural versus urban populations; (11) using combinations of interventions rather than one at a time (this was only done here in figure 5)—however, to disambiguate results, it is prudent to first examine individual interventions; (12) effect of changing disease transmission rate for different activity types; (13) effect of changing contact times at different locations; and (14) to capture close proximity transmission, one could use actual physical proximity (here, we use colocation). Finally, just as changes in modelling details can change model results, so too changes in the conditions in actual outbreaks can change results; some of these factors are listed above. It is essentially impossible to capture all of these effects—many of which are unknown—down to the level of individual humans.
Public health implications
This research demonstrates that modelling slum populations is important for understanding disease dynamics and for designing effective control measures. Ignoring the influence of slum characteristics on their urban environment will significantly underestimate the speed of an outbreak and its extent, and hence will lead to misguided interventions by public health officials and policy planners. Lessons from this research can be applied in the field, and observations collected from the field can provide valuable data to improve the models and validate the results. For example, our results show that a slum resident has about 50% greater total contact duration per day compared with a non-slum resident. This makes social distancing-based interventions more taxing in the slum population. Public health policy makers may want to subsidise pharmaceutical resources for the slum population to make them more affordable. Similarly, we find women in slums have a higher number of contacts per day than their male counterparts, whereas in non-slum regions women have a fewer number of daily contacts than their male counterparts. This kind of information can be used to prioritise the distribution of limited resources; for example, women could be given preference over men for vaccination in slum areas. This research provides simulation-based evidence that in general social distancing strategies are ineffective in slums because of a large number of contacts at home. Unless one applies complete isolation, which is not feasible in slums, just staying at home still keeps a large number of contacts and pathways of spread intact.
References
Footnotes
Contributors AA, SE, CJK, AM, MM, SS, AV designed and conceived the study. SC carried out the experiments and simulations. SC, CJK, AM performed data analysis. CJK, BL, AM, MM, EKN, MLW helped with reviewing the results and writing the paper.
Funding This work has been partially supported by the Defense Threat Reduction Agency (DTRA) (grant no. HDTRA1-11-1-0016 and HDTRA1-11-D-0016-0001), National Institutes of Health (NIH) (grant no. 1R01GM109718), National Science Foundation (NSF) (grant no. CCF-1216000, CNS-1011769 and NRT-DESE-154362), and NIH Models of Infectious Disease Agent Study (MIDAS) (grant no. 2U01GM070694-11 and 3U01FM070694-09S1).
Competing interests None declared.
Patient consent Not required.
Provenance and peer review Not commissioned; externally peer reviewed.
Data sharing statement Data pertaining to figures and statistical analysis are partially provided in the supplementary file, and also can be obtained by contacting the corresponding author through email.